Monitor deployments
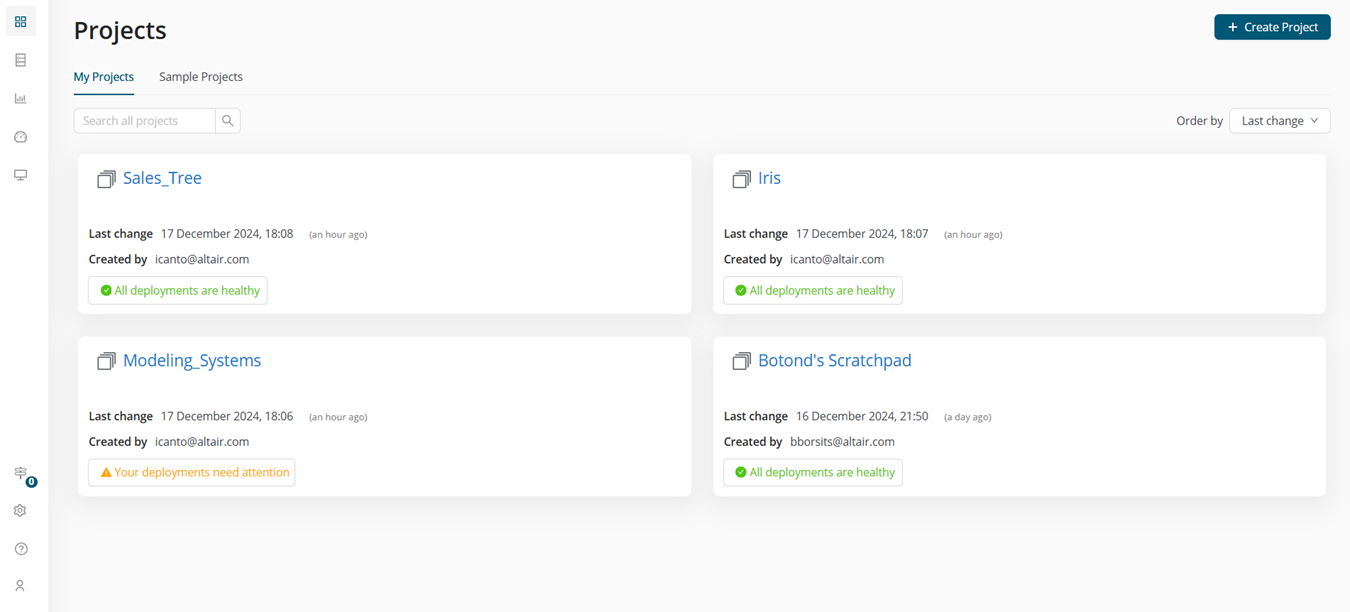
You can create any number of deployments for any project you own or have Contributor access to. When a deployment is created, the general status of this deployment is reflected in the Projects page.
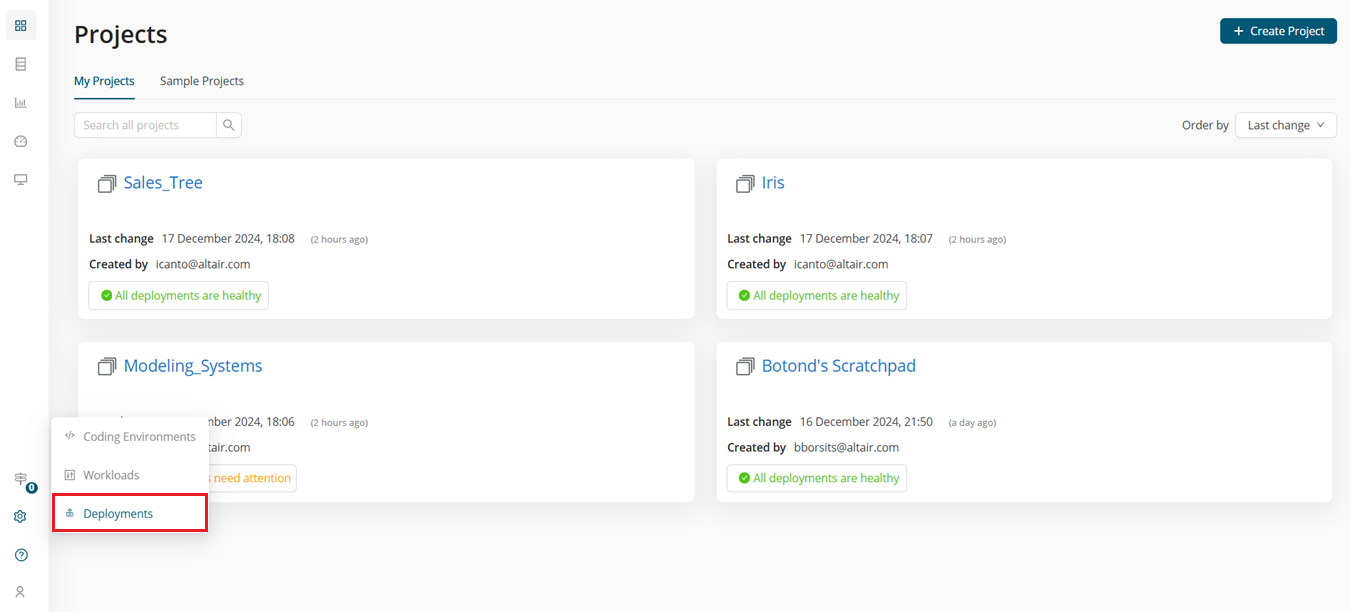
Over time, however, simply relying on the Projects page to determine the health of your deployments may become insufficient and even cumbersome, particularly if you have access to a large number of projects for which multiple deployments have been created. Altair Cloud enables admin users and machine learning engineers to monitor deployments in the Deployments page, which is accessed from the left side menu, under Controls > Deployments.
Check the status of any deployment
The Deployments page provides an overview of all deployments you have access to.
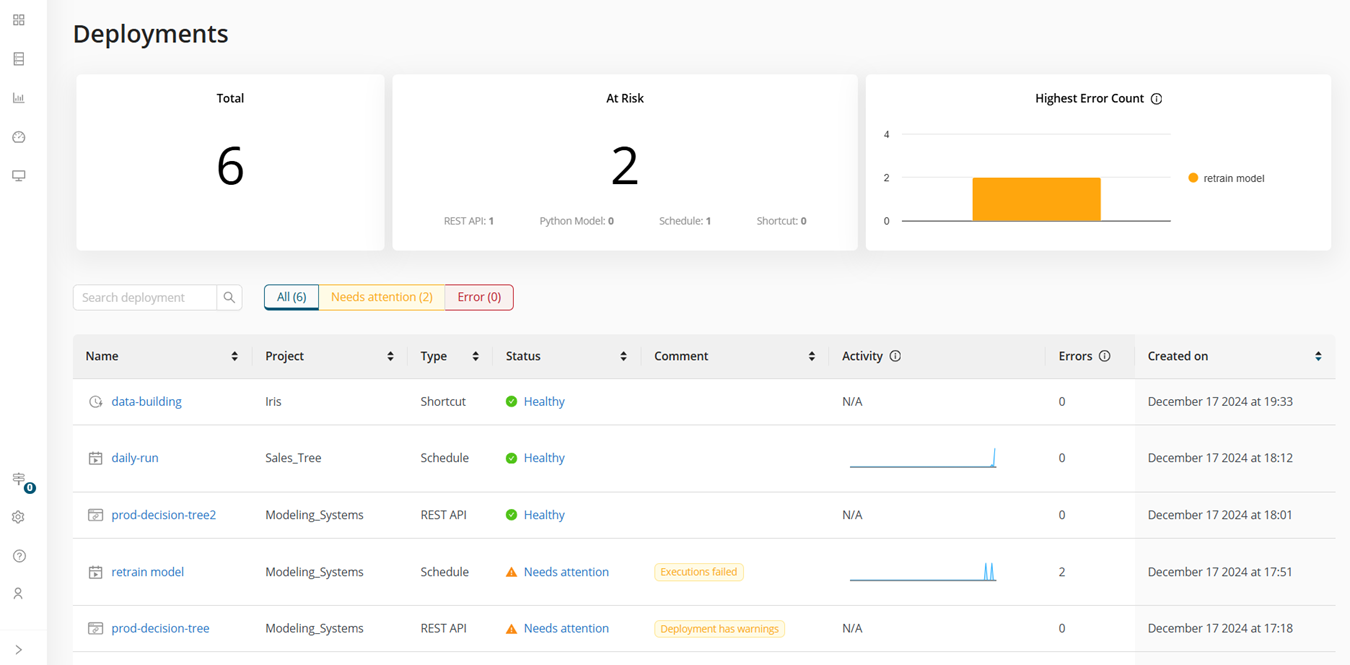
View the general status of all deployments
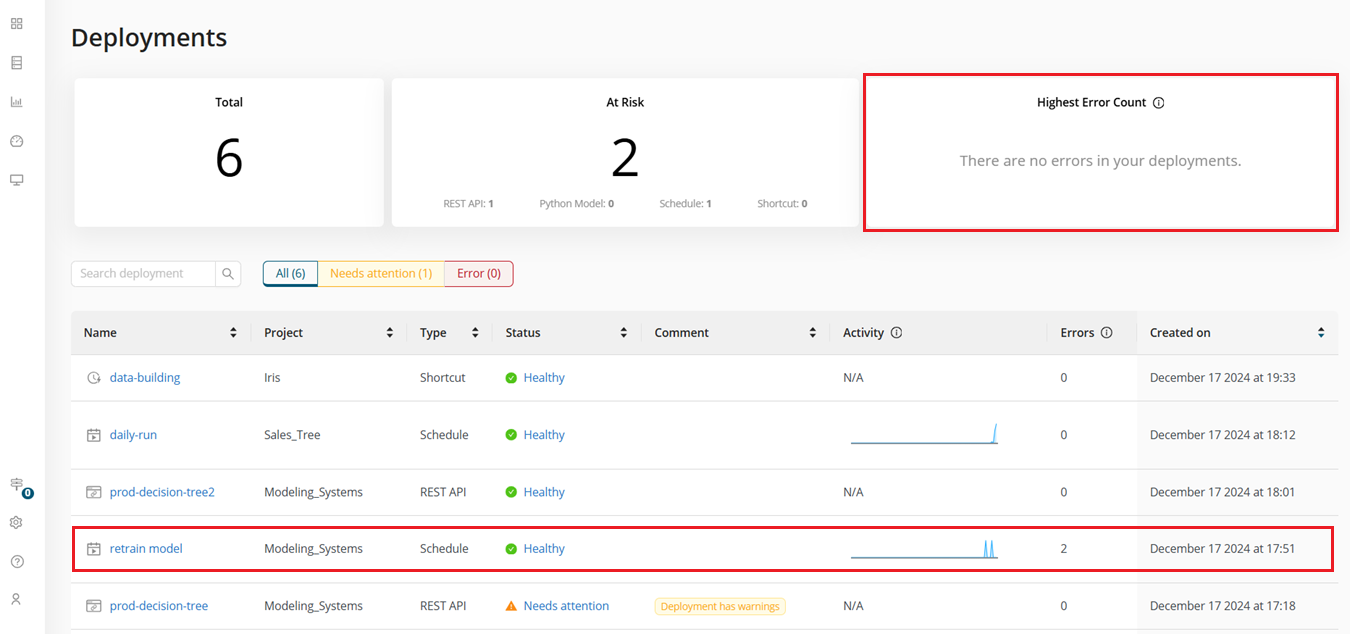
The cards at the top of the page quickly tell you:
- the total number of deployments available,
- how many and what types of deployments are at risk, and
- which deployments have the highest error counts.
Only unacknowledged errors are considered when errors for a deployment are counted.
The grid below these cards provides more details on individual deployments, including their name, the project from which they were created, their type and status, additional comments, activity, error counts recorded over the last 24 hours, and creation date.
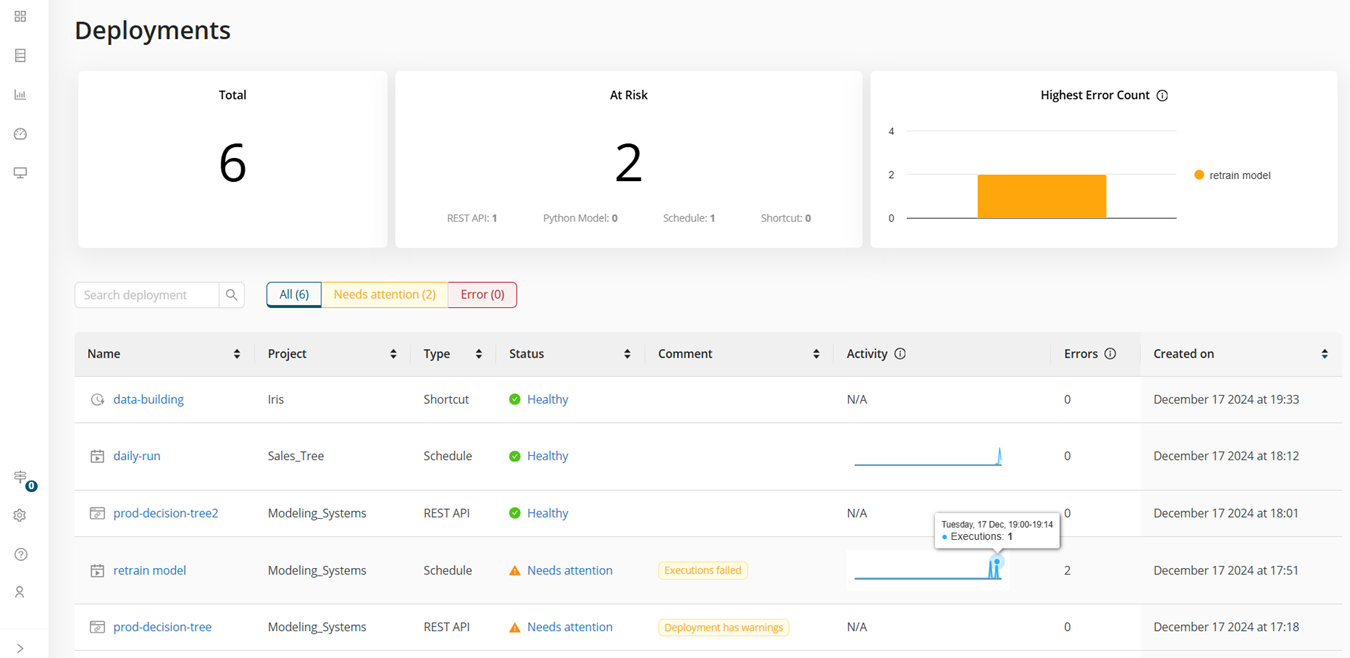
Hovering over a plot in the Activity column displays information on the number of executions carried out over the past 24 hours.
Filter for a deployment
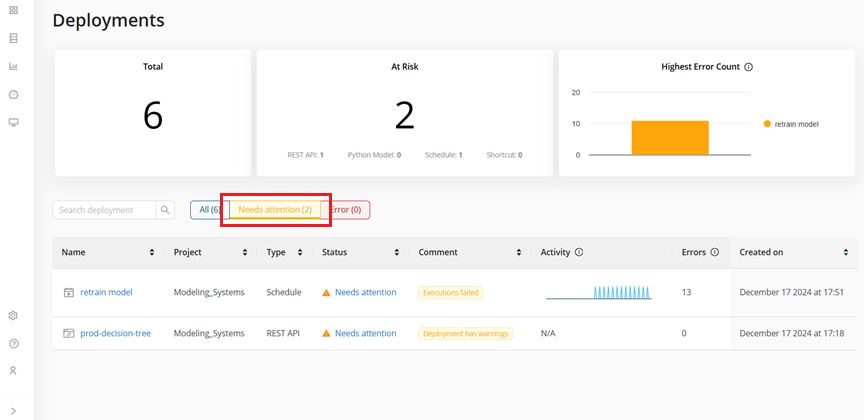
You can filter for a specific deployment by:
- entering a search string into the Search bar
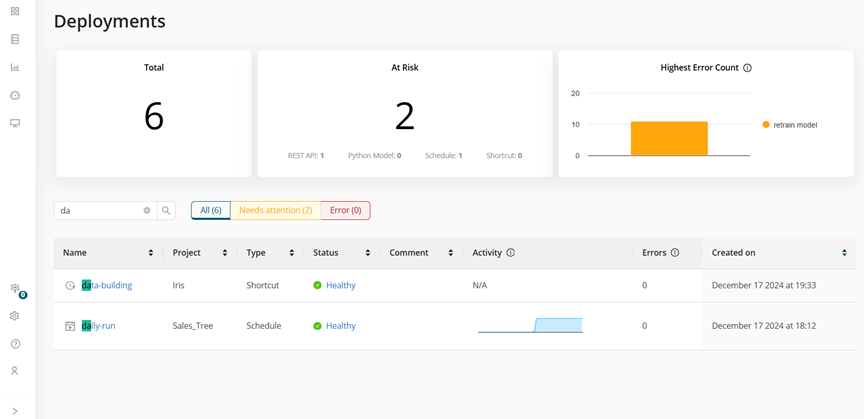
- or clicking the corresponding button to view all deployments, those that need attention, or those in an error state.
Sort deployments
By default, deployments are sorted according to their creation date, with newer deployments appearing at the top of the grid. You can sort deployments according to some other criteria, such as Name or Project, by clicking the sorting buttons located to the right of each column header.
Check the health of a deployment
The names and states of all deployments are provided as links in the Deployments page. When the name of a deployment is clicked in the Deployments page, you are brought to its Details page.
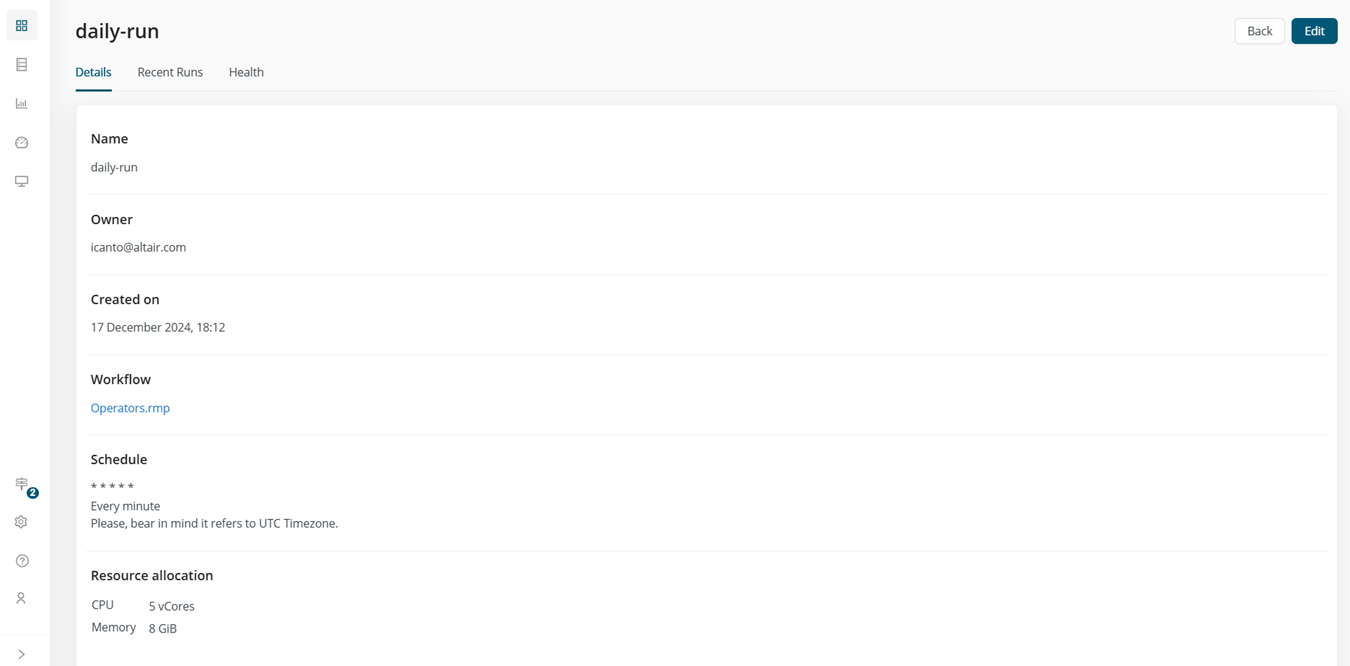
From here, you can select the Health tab.
When the status of a deployment in the Deployments page is clicked, you are directly brought to the Health page for this deployment.
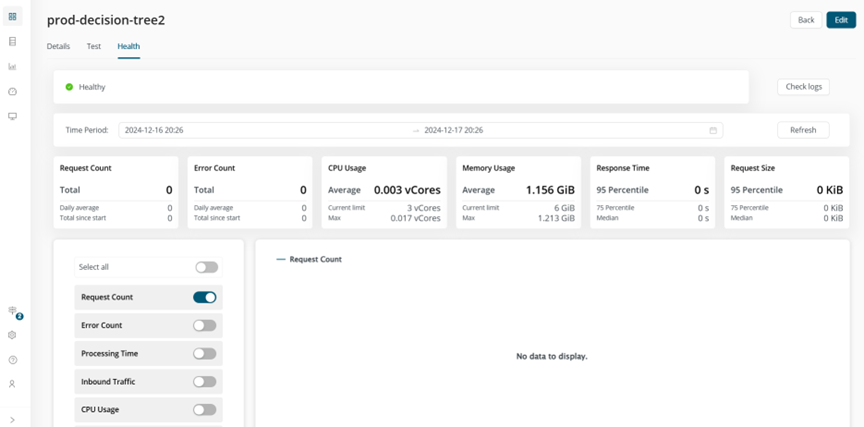
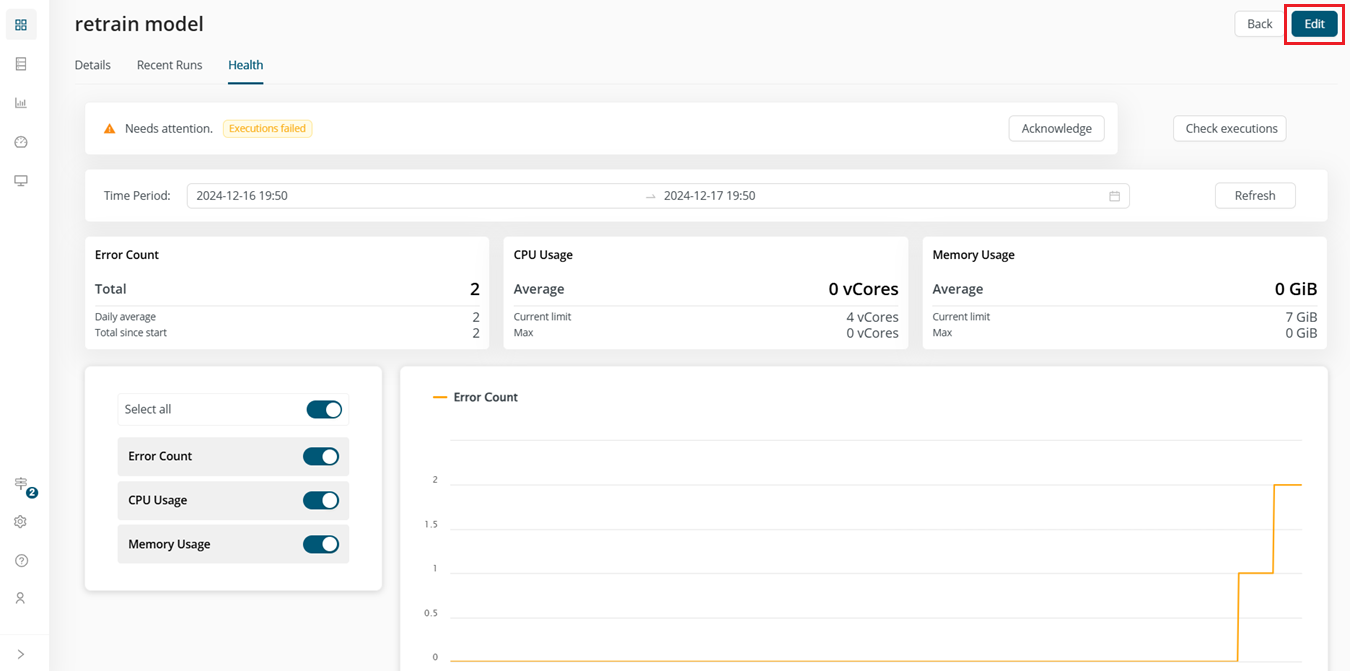
The top of the Health page displays the status of your deployment:
- Healthy
- Needs attention
- Error
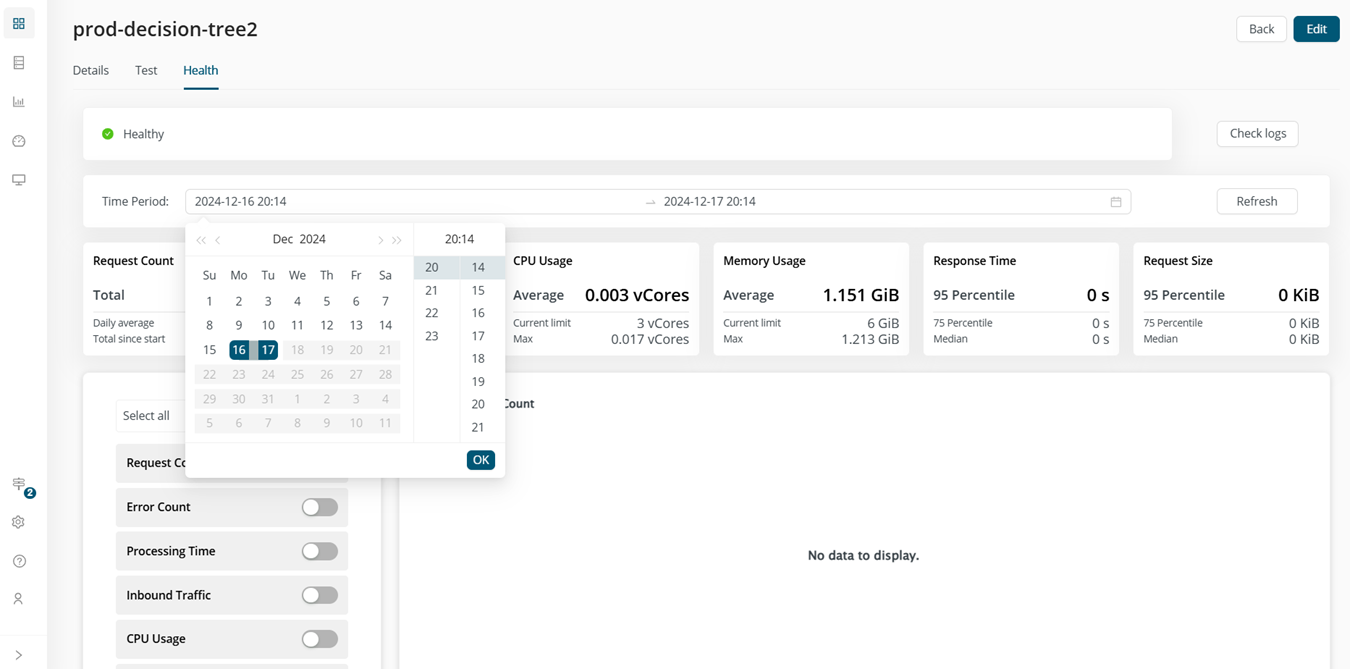
You can check the status of your deployment over a certain time period, which, by default, is the past 24 hours. If necessary, you can set a different date/time period to check your deployment states for up to 6 months earlier than the current time.
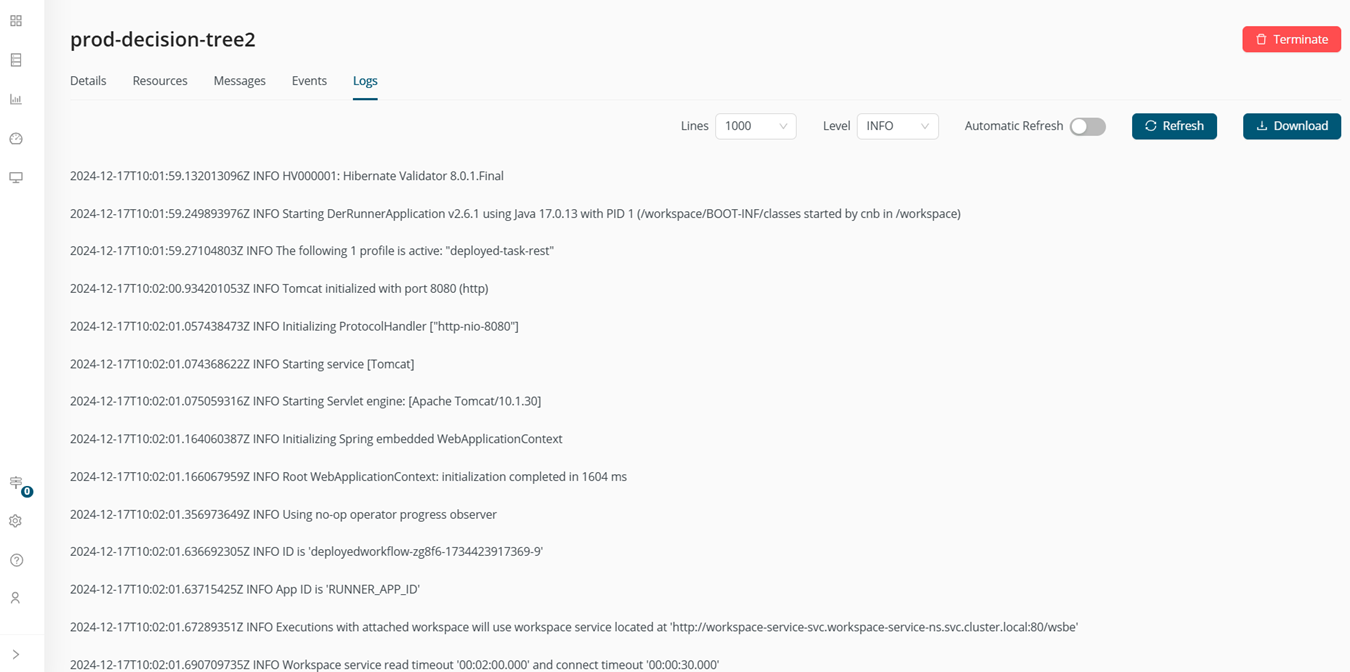
Selecting the Check logs button takes you to the Logs tab of the Workloads / (name of deployment) page, where you can view details related to your deployment’s executions.
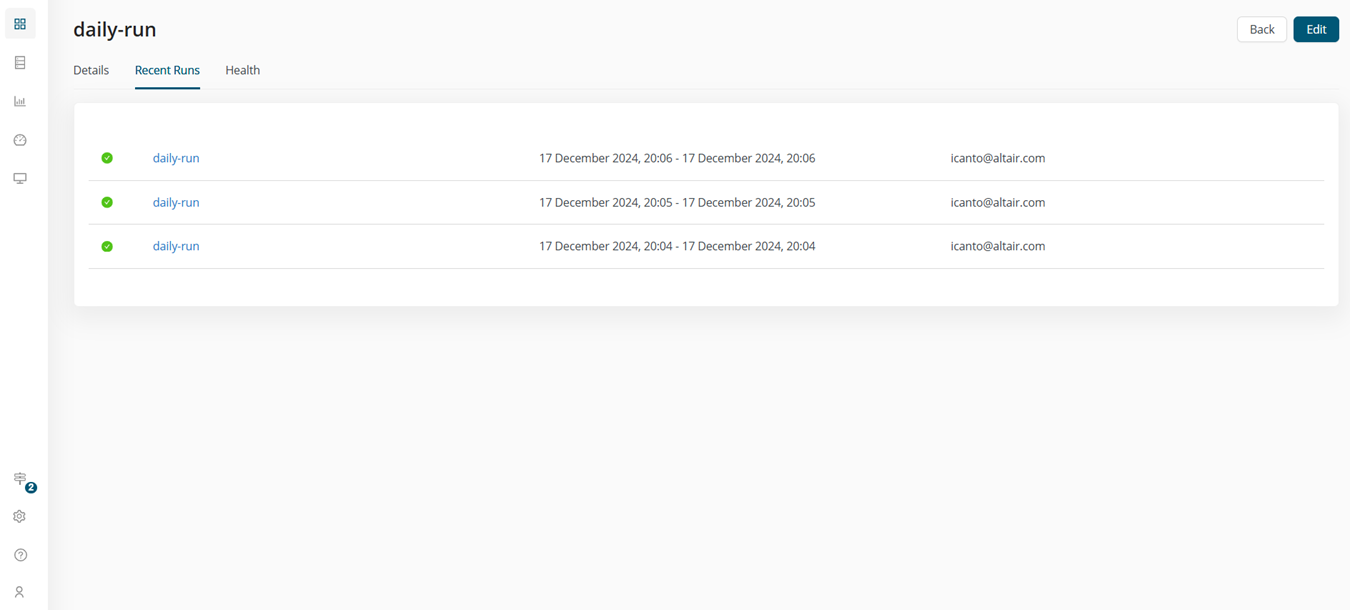
Instead of the Check logs button, some types of deployments, such as Schedules and Shortcuts, have a Check Executions button. Selecting this button takes you to the Recent Runs tab of the Details page of your deployment, allowing you to check whether the expected executions were successfully completed.
Different tiles in the Health page present different types of information related to your deployment. These tiles vary depending on the type of deployment created. For example, if your deployment is a Rest API, tiles for the following items display.
- Request count
- Error count
- CPU usage
- Memory usage
- Response time
- Request size
However, if your deployment is a Schedule, only tiles for the following display.
- Error count
- CPU usage
- Memory usage
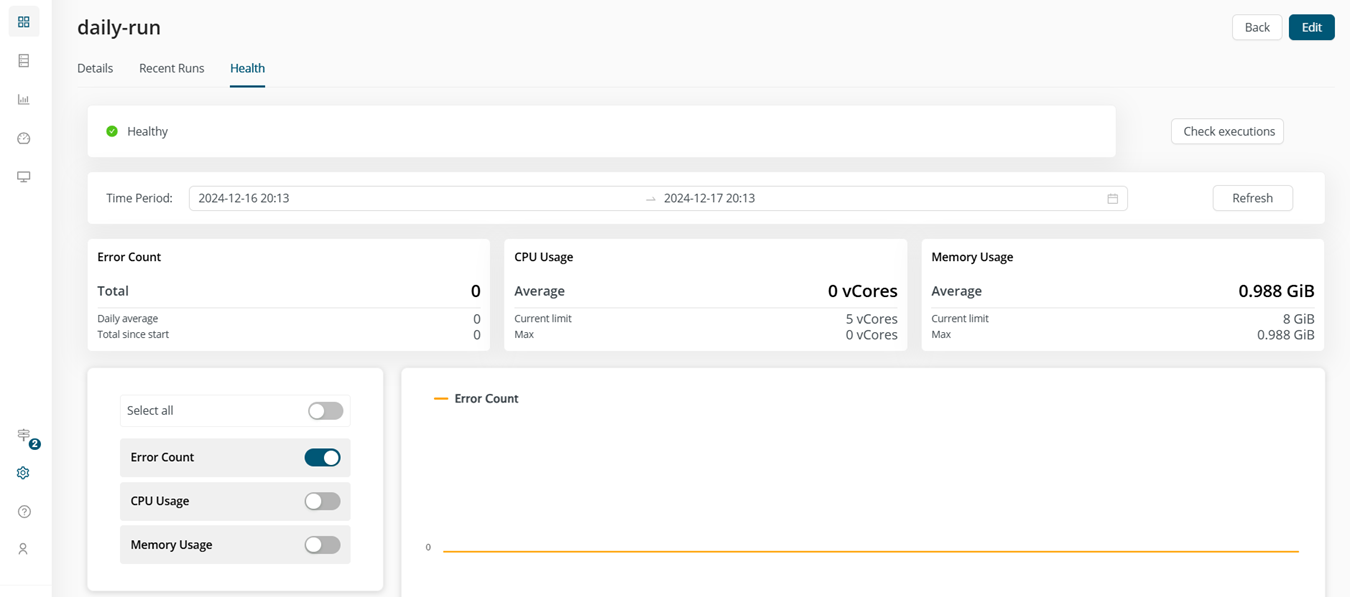
Knowledge of a deployment’s CPU and memory usage will help you determine whether your deployment was overprovisioned.
If you observe that the CPU and memory usage of your deployment is well below the values you allotted for it, you may consider editing this deployment to reduce its resource allocation, thereby freeing up resources for other purposes.
Charts corresponding to these tiles are also available to help you visualize the actual details of a deployment’s execution, identifying spikes where errors could potentially occur. Which charts should display on the page can be selected by enabling them in the selector provided.
Fix deployment errors
The errors in a deployment can be fixed via a number of ways:
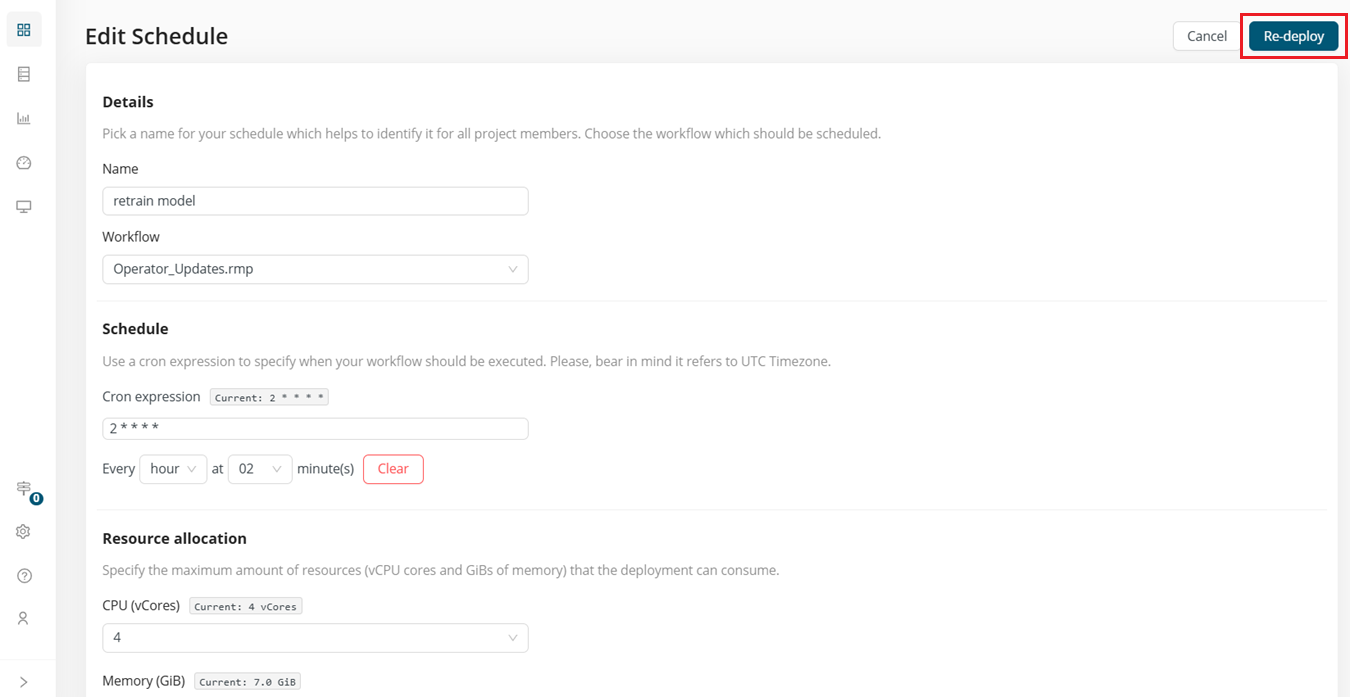
Edit the properties of a deployment
You can edit the properties of an unhealthy deployment to fix errors arising from incorrectly set parameters.
Once edited, re-deploy the deployment.
Acknowledge the error
Because deployments are usually created for integration with other systems, errors can arise from either side of this integration, and your deployment may be marked as unhealthy even if it was, in fact, created correctly. You may choose to simply acknowledge an unhealthy deployment if you have fixed it or are certain that the error is not due to issues related to its creation.
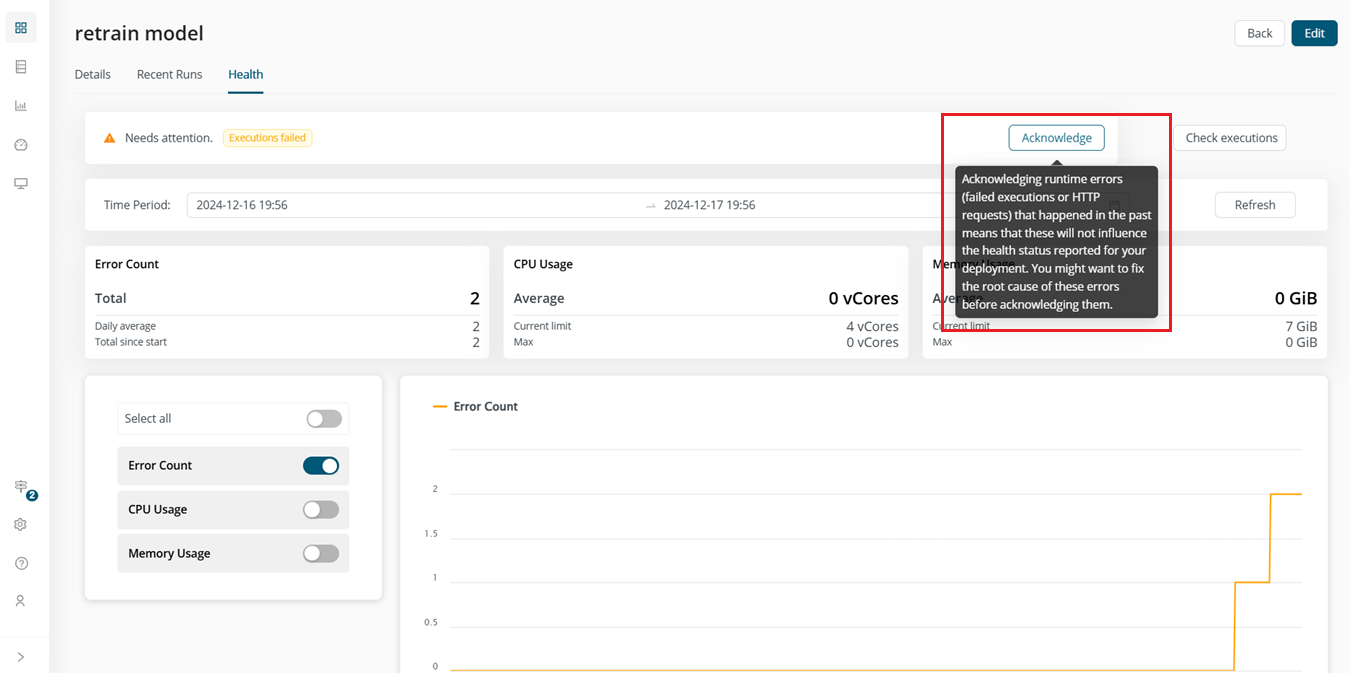
When an unhealthy deployment is acknowledged, its status changes from Needs attention to Healthy.
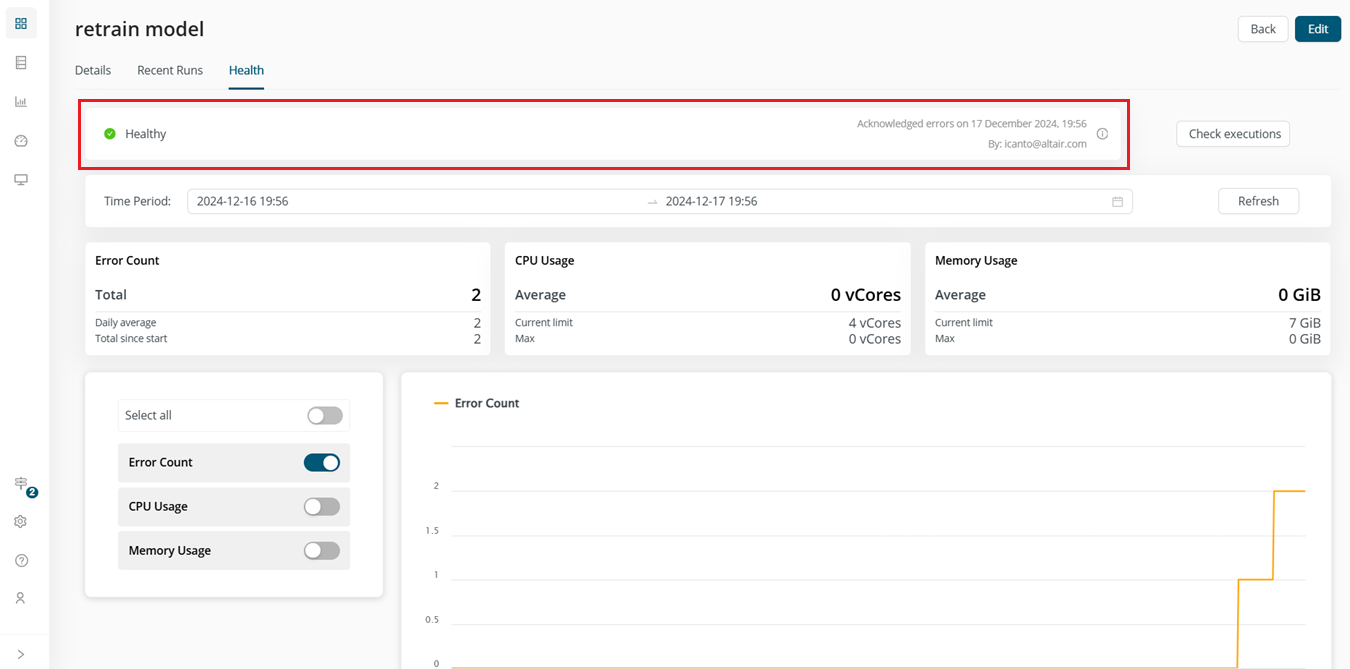
In addition, the Deployments page is updated and errors for the deployment are no longer counted.
Delete and recreate the deployment
In some cases, the only way to fix a deployment is to delete and recreate it.