Auto Clustering
Auto Clustering is designed to help you build a clustering model from your data. All you need is a data set to start with. It's that simple!
In the following sections we will first explain briefly what clustering is and for what it can be used and then walk you through the necessary steps to create a new clustering model on a data set.
What's the difference between Auto Clustering and Auto Machine Learning?
Clustering is a machine learning technique that groups your data automatically into categories. The difference to classification or regression models used in AutoMachine Learning is that clustering doesn't require a label column to begin with. Instead, the clustering algorithm tries to find the best way to group the given data on its own. That is why clustering is also called an unsupervised machine learning algorithm.
This feature makes clustering an excellent tool for exploratory data analysis and a great starting point for a new project. It can also be useful to detect hidden patterns and similarities that are easy to overlook otherwise.
Build your clustering model
Building a new clustering model is fast and simple. As the models follows an unsupervised approach, there are only a few choices the user has to make.
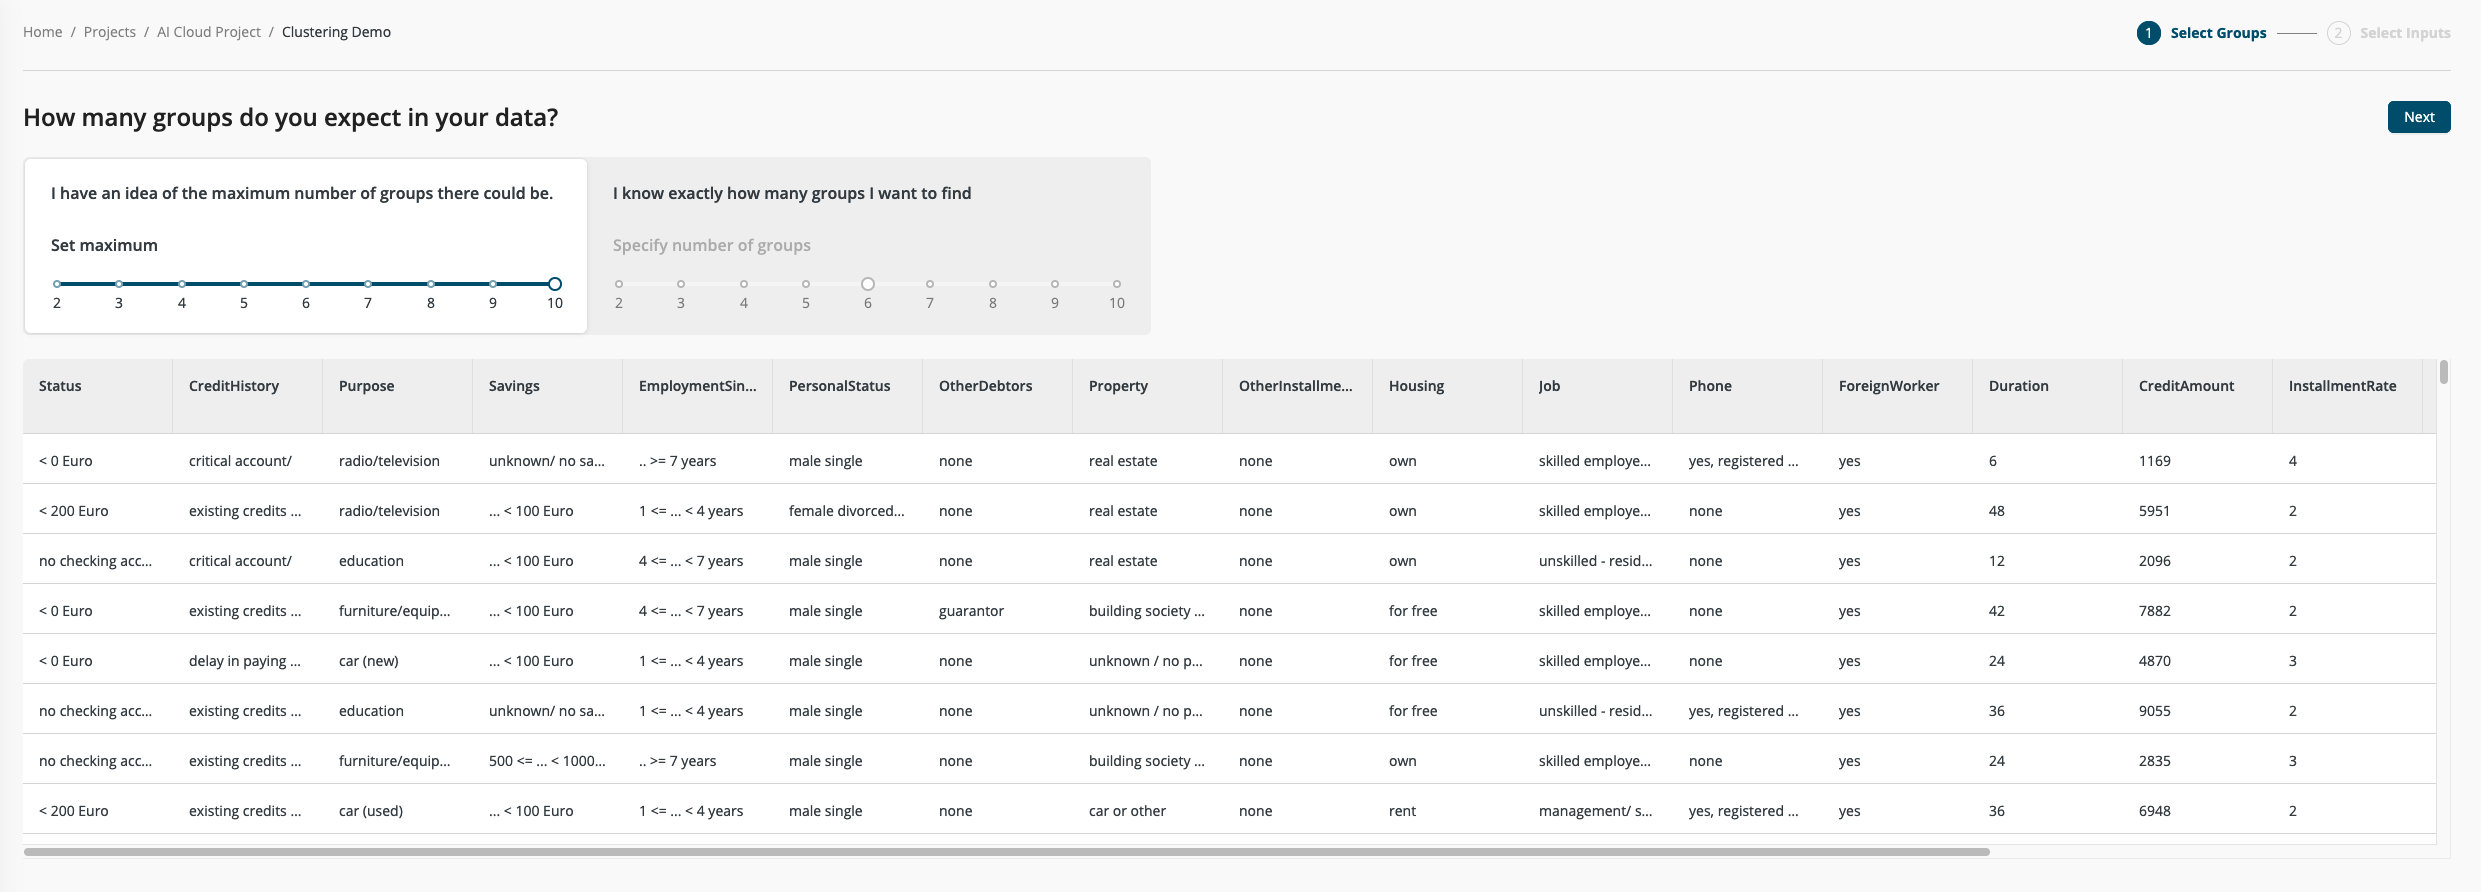
Step 1: Choose number of groups
The single and most important parameter for clustering is the number of groups the algorithm tries to find. This number can of course be very tricky to choose when you don't have much insight into the data to begin with. So, as a default setting, Auto Clustering will try out every possible number of groups between two and ten. The algorithm will try to find the smallest number of clusters that still have a very strong separation between each other.
Optionally, you can specify the exact number of groups the algorithm will use. This can be helpful if you already have a notion about the distribution of your data, or if there are other constraints on how you can handle the groups afterwards.
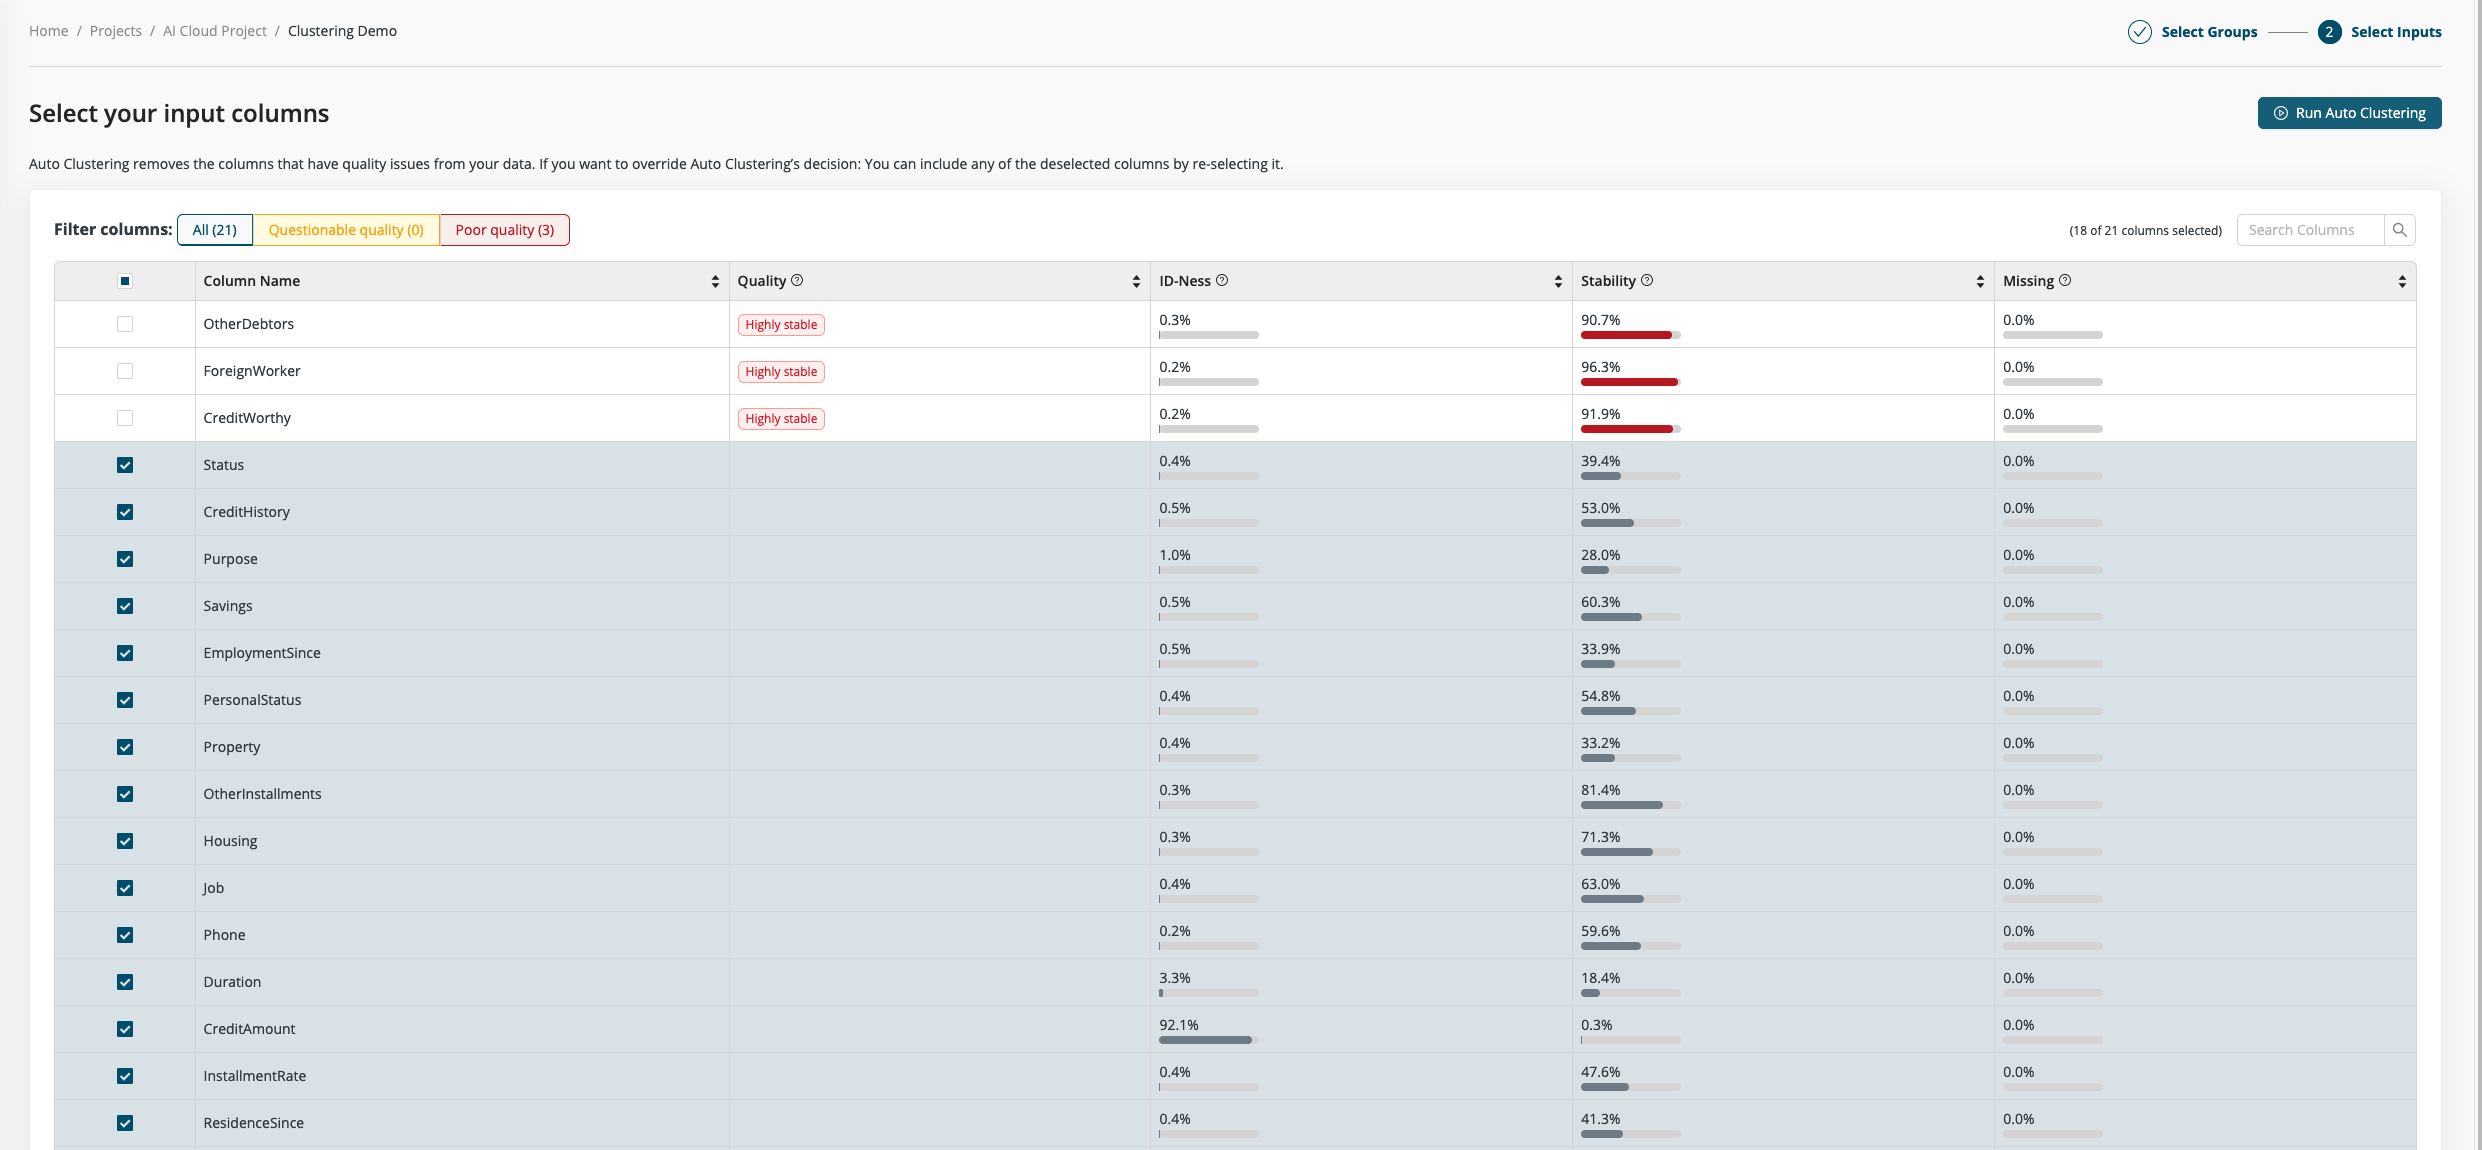
Step 2: Select Inputs
Not all columns are equally useful when finding clusters. While in general a higher number of columns offers more information, it also makes finding good clusters more difficult. More data columns (more dimensions) add more noise and make distinctive patterns harder to spot.
We offer a quality assessment for the input columns that can help you to identify and remove unwanted columns. The columns are automatically divided into three categories, with poor quality columns excluded by default.
Once you are satisfied with your input selection you can start Auto Clustering. There's really nothing more to configure.
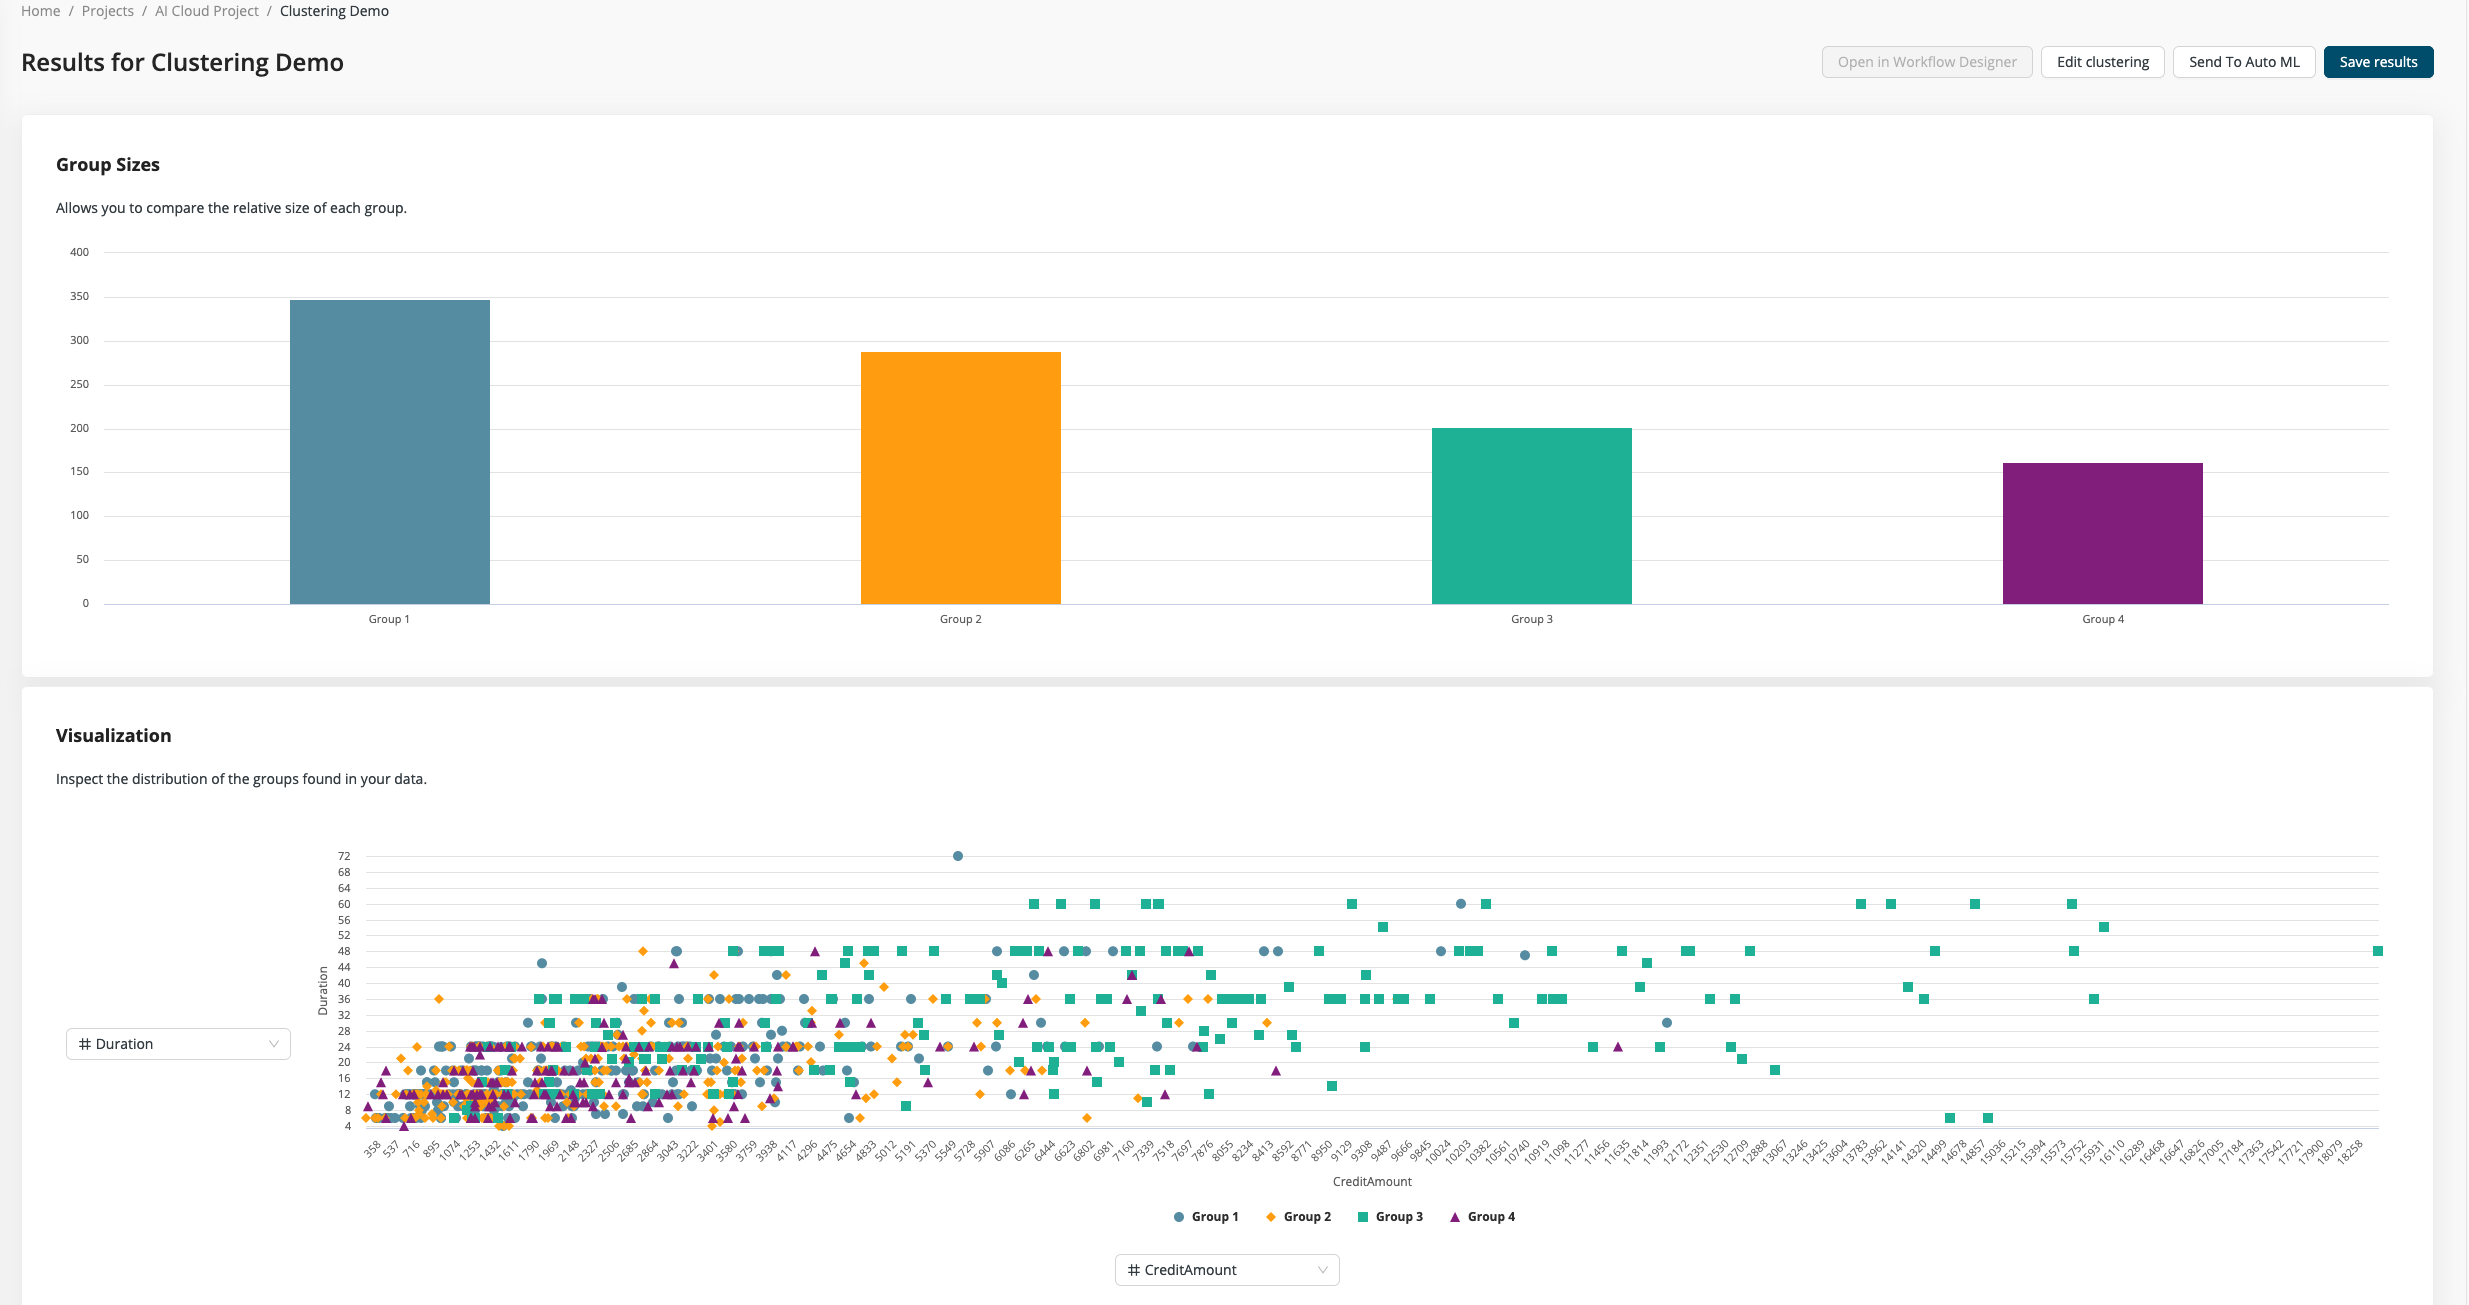
Step 3: Inspect Results
On the results page, you can inspect how your data was grouped into different clusters.
You can see the size of the different groups and how the groups are distributed among the different input columns. Here you can try out different combinations of column pairs to start exploring your results. Each group is highlighted with a different color and shape, so it's easy to spot where the groups have a clear separation or where they overlap. Of course, in real world examples, there's rarely a perfect separation possible and so there will always be some not so clear separations.
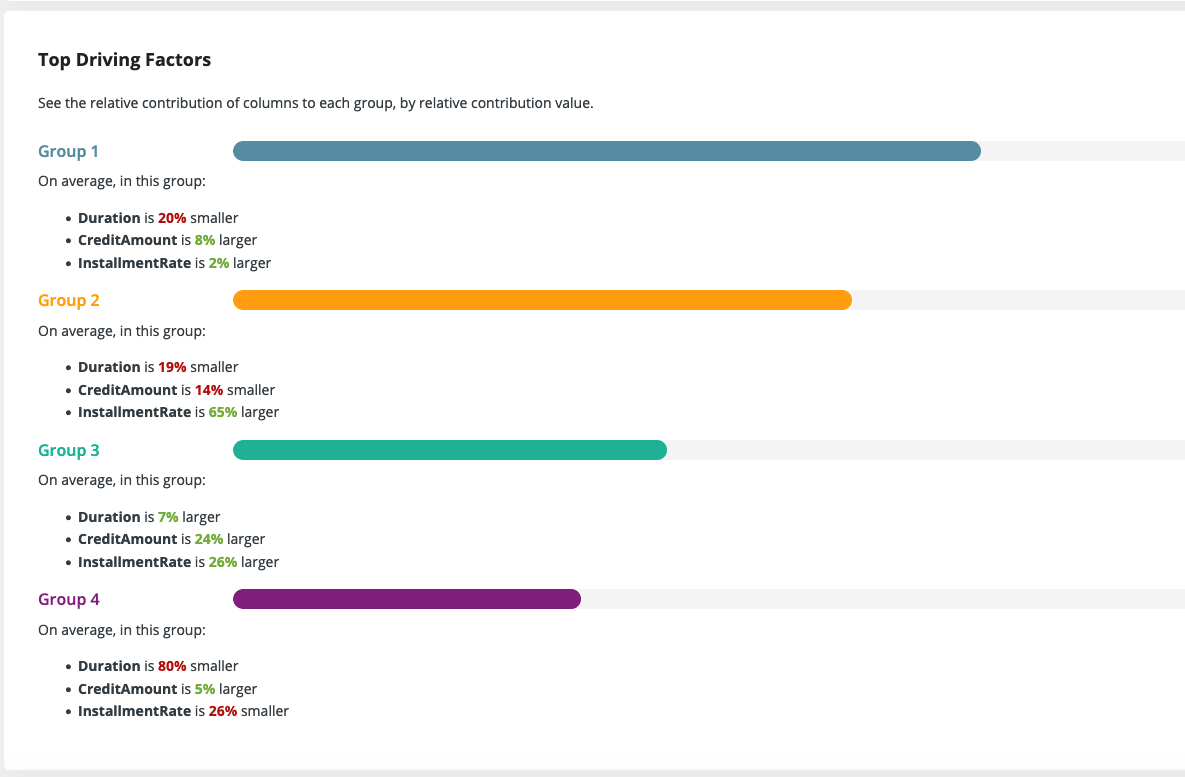
For large data sets trying out all combinations can be quite exhausting, so we also provide a nice summary of the top three difference in each group. This short description really catches the essence of all the groups and can yield great insights of the relationship between different columns.
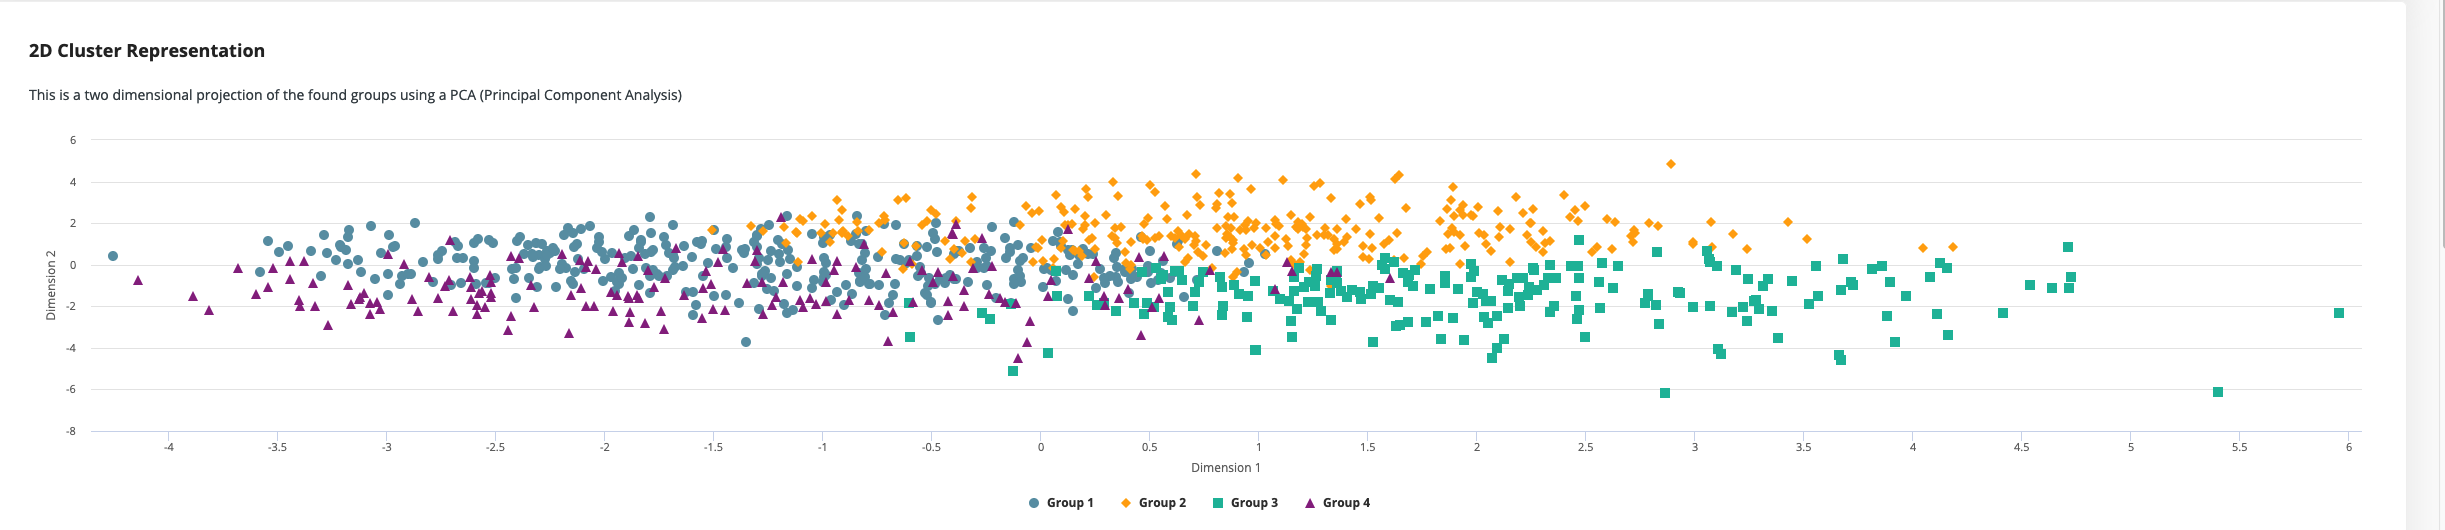
We also show a two-dimensional projection of the data using a technique called Principal Component Analysis (PCA). This projection is useful to verify how good the separation between the groups is and to show the general relationship between different groups. Are groups one and two very close together and far away from a third group? Then maybe these two groups could be regarded as one, or at least be treated similarly.