Auto Feature Engineering
Auto Feature Engineering provides a unique way to derive optimal feature sets for modeling tasks. It combines automatic generation of new features based on your data with selection of the most important features. The output delivers a tradeoff between model complexity and predictive performance.
To use Auto Feature Engineering:
- You only need a data set and a column you want to predict.
- Then choose the maximum time you want the optimization to run.
Normally the default five minutes are enough for very accurate results, because in that time thousands of evaluations are already performed.
A simple example
Before the discussing the more general aspects of feature engineering, let us consider a simple, if slightly artificial, example.
Suppose your only modeling tool is linear regression. In this overly simple world, all your data has to fit a straight line. If and when you have approximately straight-line data, you can expect to make good predictions. But what do you do if the inherent relation between your input data and the target data is not linear?
-
Question: Suppose the inherent relation is quadratic?
Answer: You can take the square root of the input data, and then the relationship is linear.
-
Question: Suppose the inherent relation is a power law?
Answer: You can take the logarithm of the input data, and then the relationship is linear.
In either of the above examples, you can now expect your model to work reasonably well.
This is the basic idea of feature engineering: that you can compensate for the weaknesses of your model or your data by transforming the data. The endpoint of this process is a model optimized for better performance -- or, perhaps, identical performance with a reduced number of input variables.
More complex problems
In general, the problem you are working on will be more complicated than the one described above.
-
The number of data columns may be very large, and it's not a given that you will have any intuition for the relation between each input column and the target column.
-
Your model will be more sophisticated than linear regression, but even more sophisticated models have their weaknesses.
When applying feature engineering to these more complex problems, you can make your life easier by automating the process of generating new features and then analyzing those features. In an attempt to find features that better match the problem at hand, the automation should
- transform the initial input columns, as described above, and also
- combine these input columns in various ways.
For example, the Body Mass Index (your body weight divided by the square of your height) is a relatively complex feature requiring the combination of two existing data points (height and weight). Even if you limit yourself to the most common transformations and combinations of variables, the resulting number of generated features may become enormous.
The final step of the problem, then, is to evaluate these new features in the context of your model and to discover to what extent they may be more useful than the original data set. After discarding the less relevant features, you will hopefully obtain a smaller and more powerful set of input data.
Model complexity
While in general more sophisticated models have more predictive power, model complexity is a two-edged sword. With a more complex model, the risk is that you can exactly match your training data, but that the model will fail when confronted with new data. This dilemma is a fundamental feature of data science; it is an important reason why there is no one-size-fits-all model that will perform optimally under every circumstance.
The trend in data science is towards larger and larger data sets, analyzed with the help of sophisticated models such as deep learning. Because deep learning models can create their own features, you may read statements such as the following:
Deep learning removes the need for feature engineering, replacing complex, brittle, engineering-heavy pipelines with simple, end-to-end trainable models that are typically built using only five or six different tensor operations.
François Chollet, Deep Learning with Python
This statement is certainly true, given the right context -- a context in which
- you have a large enough amount of data that your problem is amenable to deep learning and
- you have sufficient computing resources to build deep learning models.
But if your data set or computing resources are smaller, a simpler model may be perfectly adequate for your task. And with that simpler model, you may get some benefit from feature engineering.
In any case, Auto Feature Engineering makes the creation of optimal data sets so easy, you might as well try!
Example: Car Prices
Download: Car price data set
For our example, we examine a data set involving used car prices.
The data set includes obviously important features such as Milage, Brand,
and Fuel consumption, plus a number of extras, including security and comfort
features. We will run Auto Feature Engineering on this data set to answer
two questions:
- Can we auto-generate new, possibly more relevant features from the initial data set?
- Can we diminish the total number of input data columns, to make the input more relevant?
A project named Car_Prices has been created, and the car_price data set has been uploaded to this project, as illustrated.
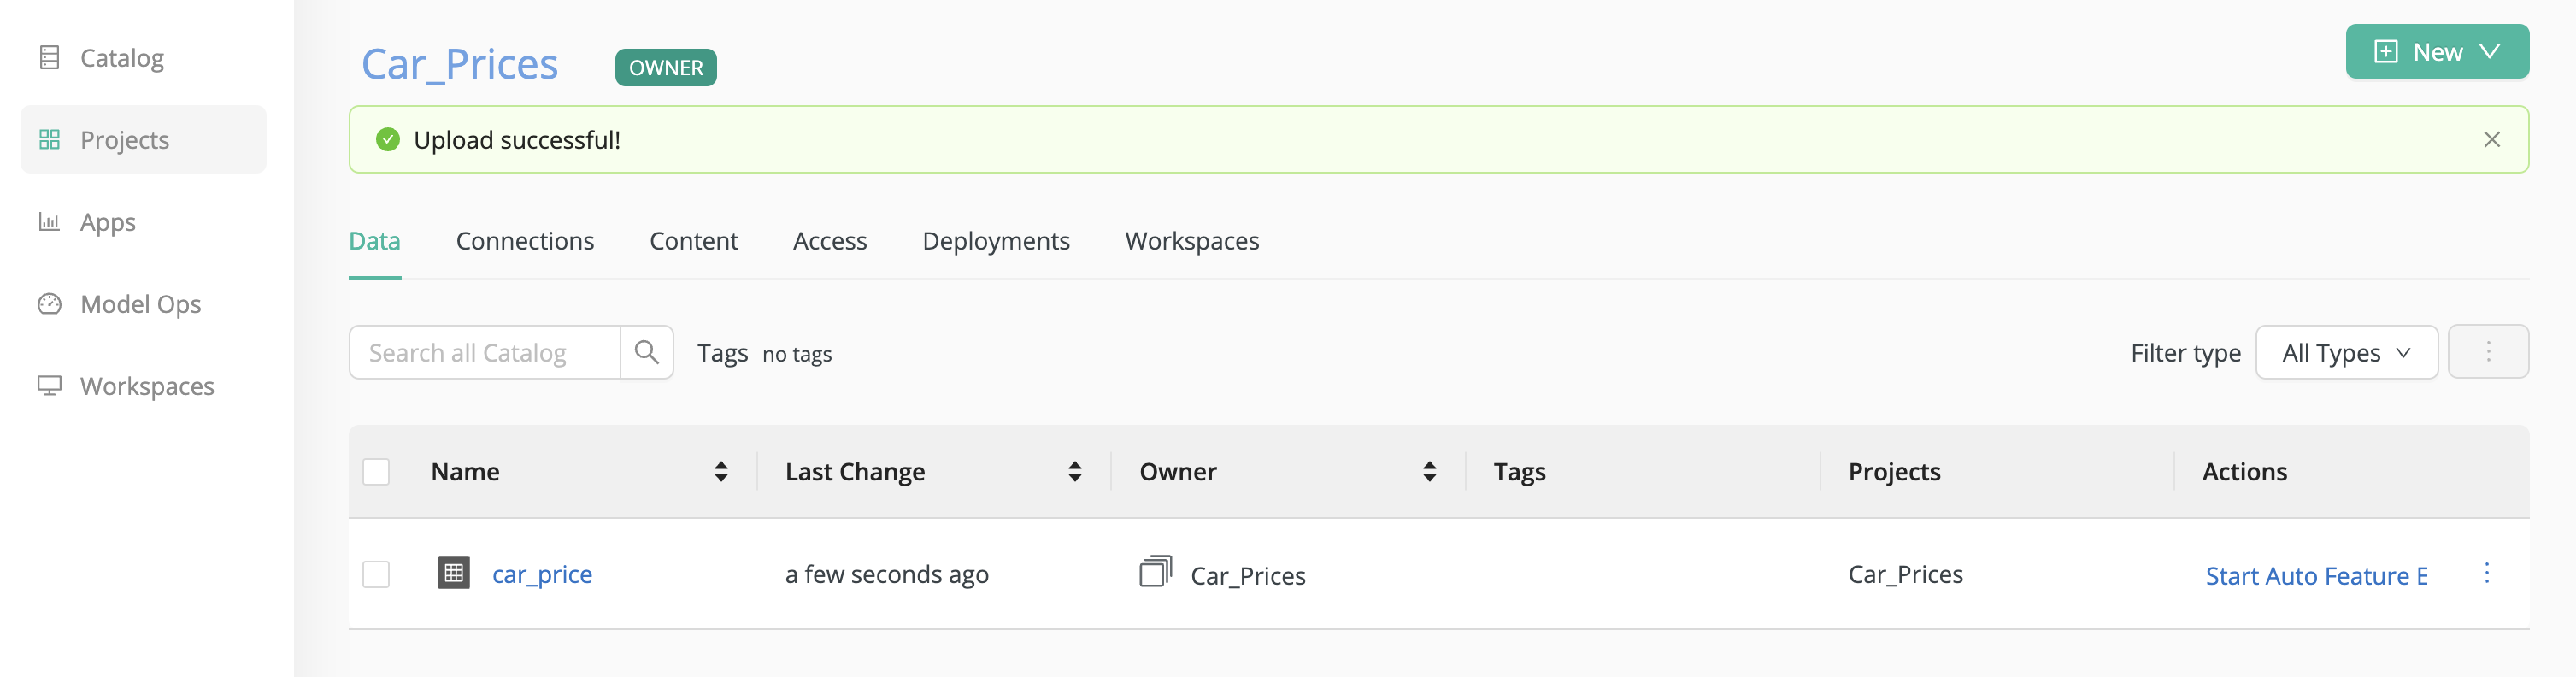
To start Auto Feature Engineering directly, click Start Auto Feature Engineering, under Actions, in the Data tab of the project.
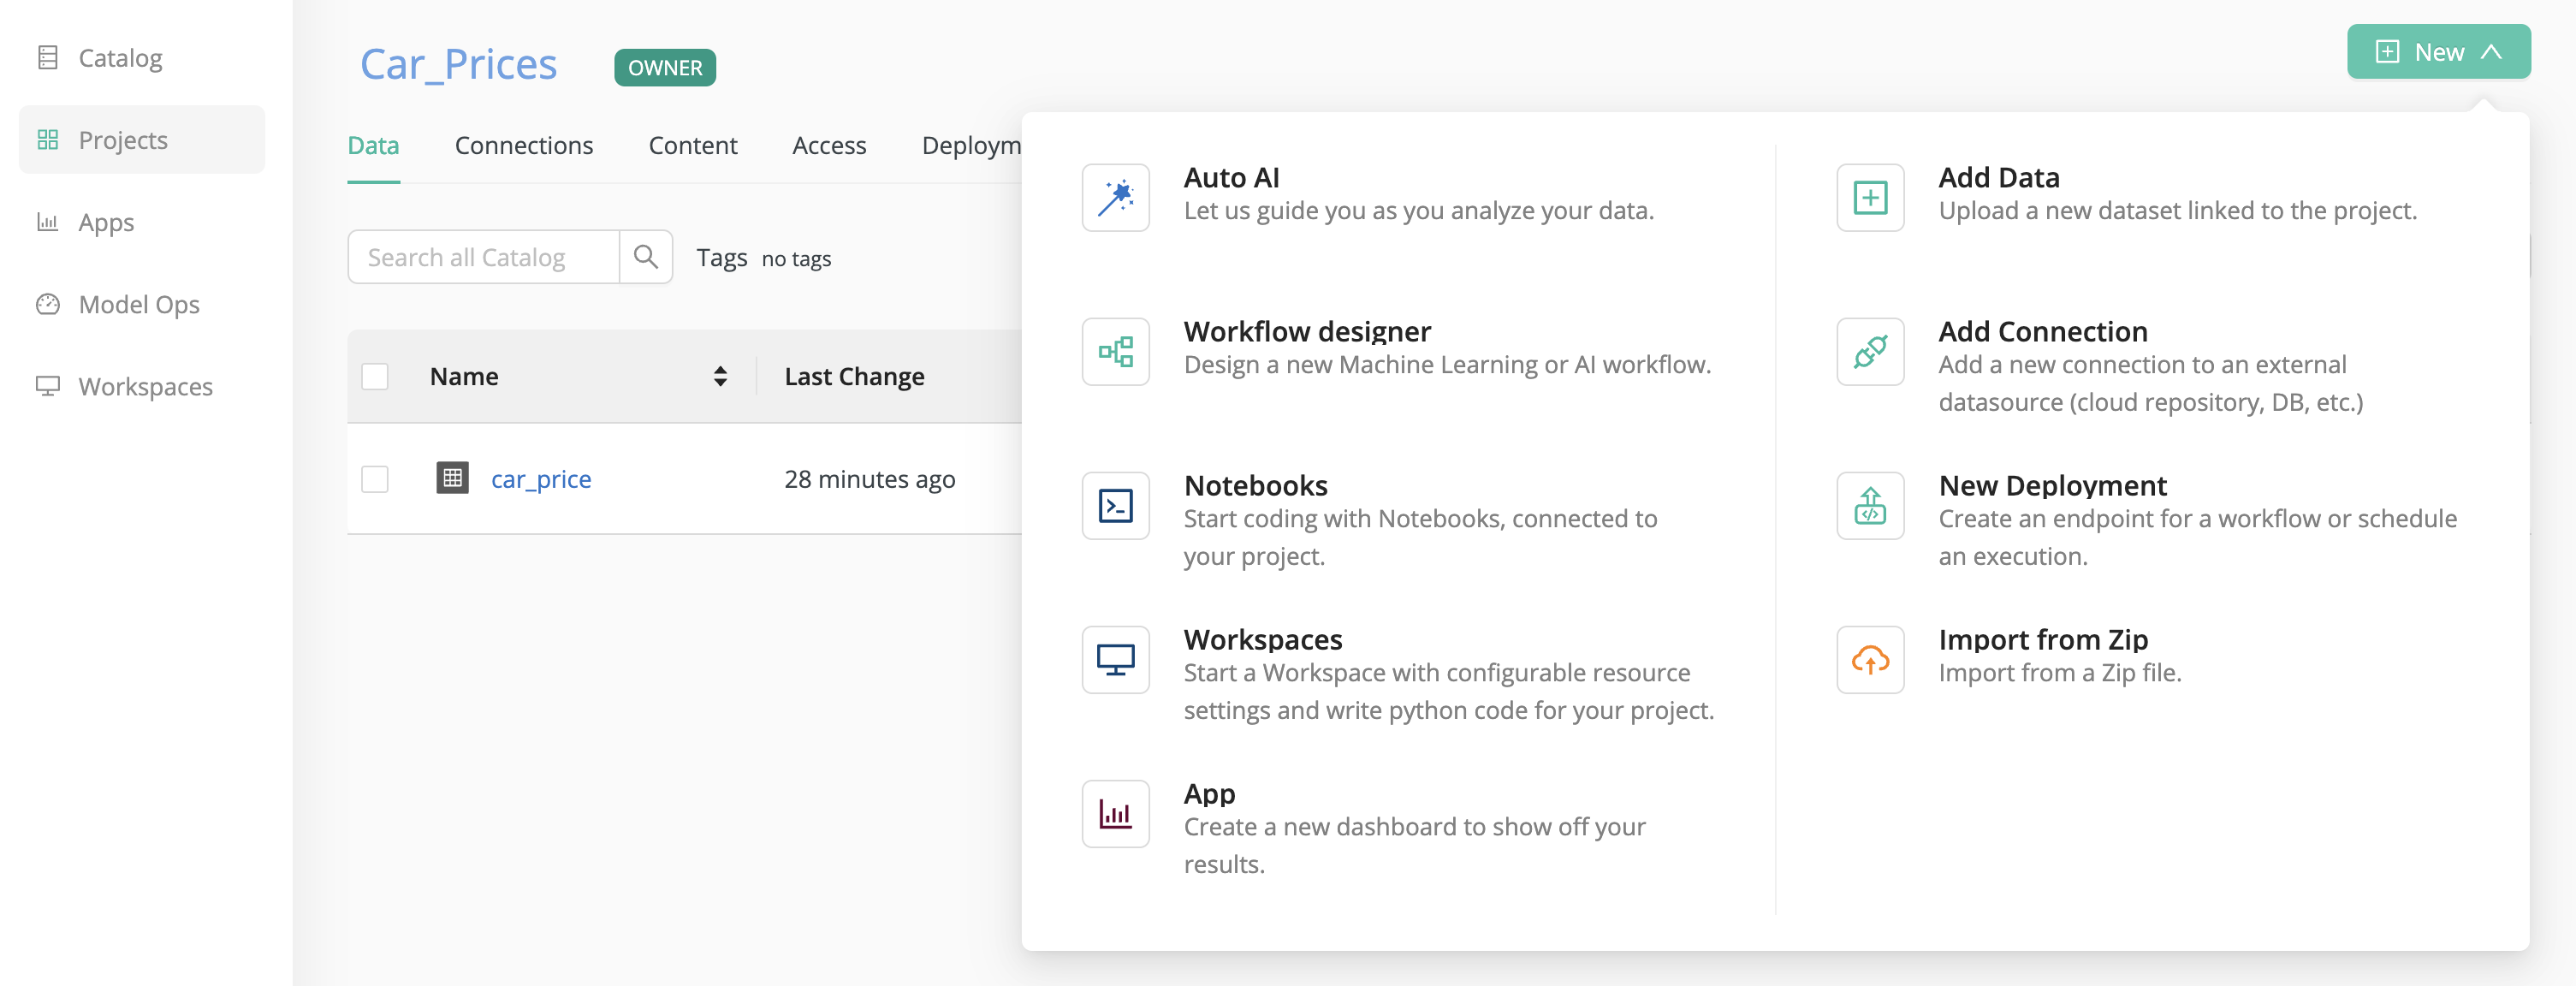
Alternatively, you can
- click on New in the upper right hand corner,
- choose Auto AI,
- select your data set, click Next,
- then select Auto Feature Engineering.
A dialog appears where you have to make three choices:
- Name - The name you assign to this analysis
- Column to Predict - The name of the column whose value you want to predict, in this case Cash Price.
- Maximum Time - The time that Auto Feature Engineering will spend generating and analyzing new features. The minimum time, 5 minutes, is usually adequate to give good results.
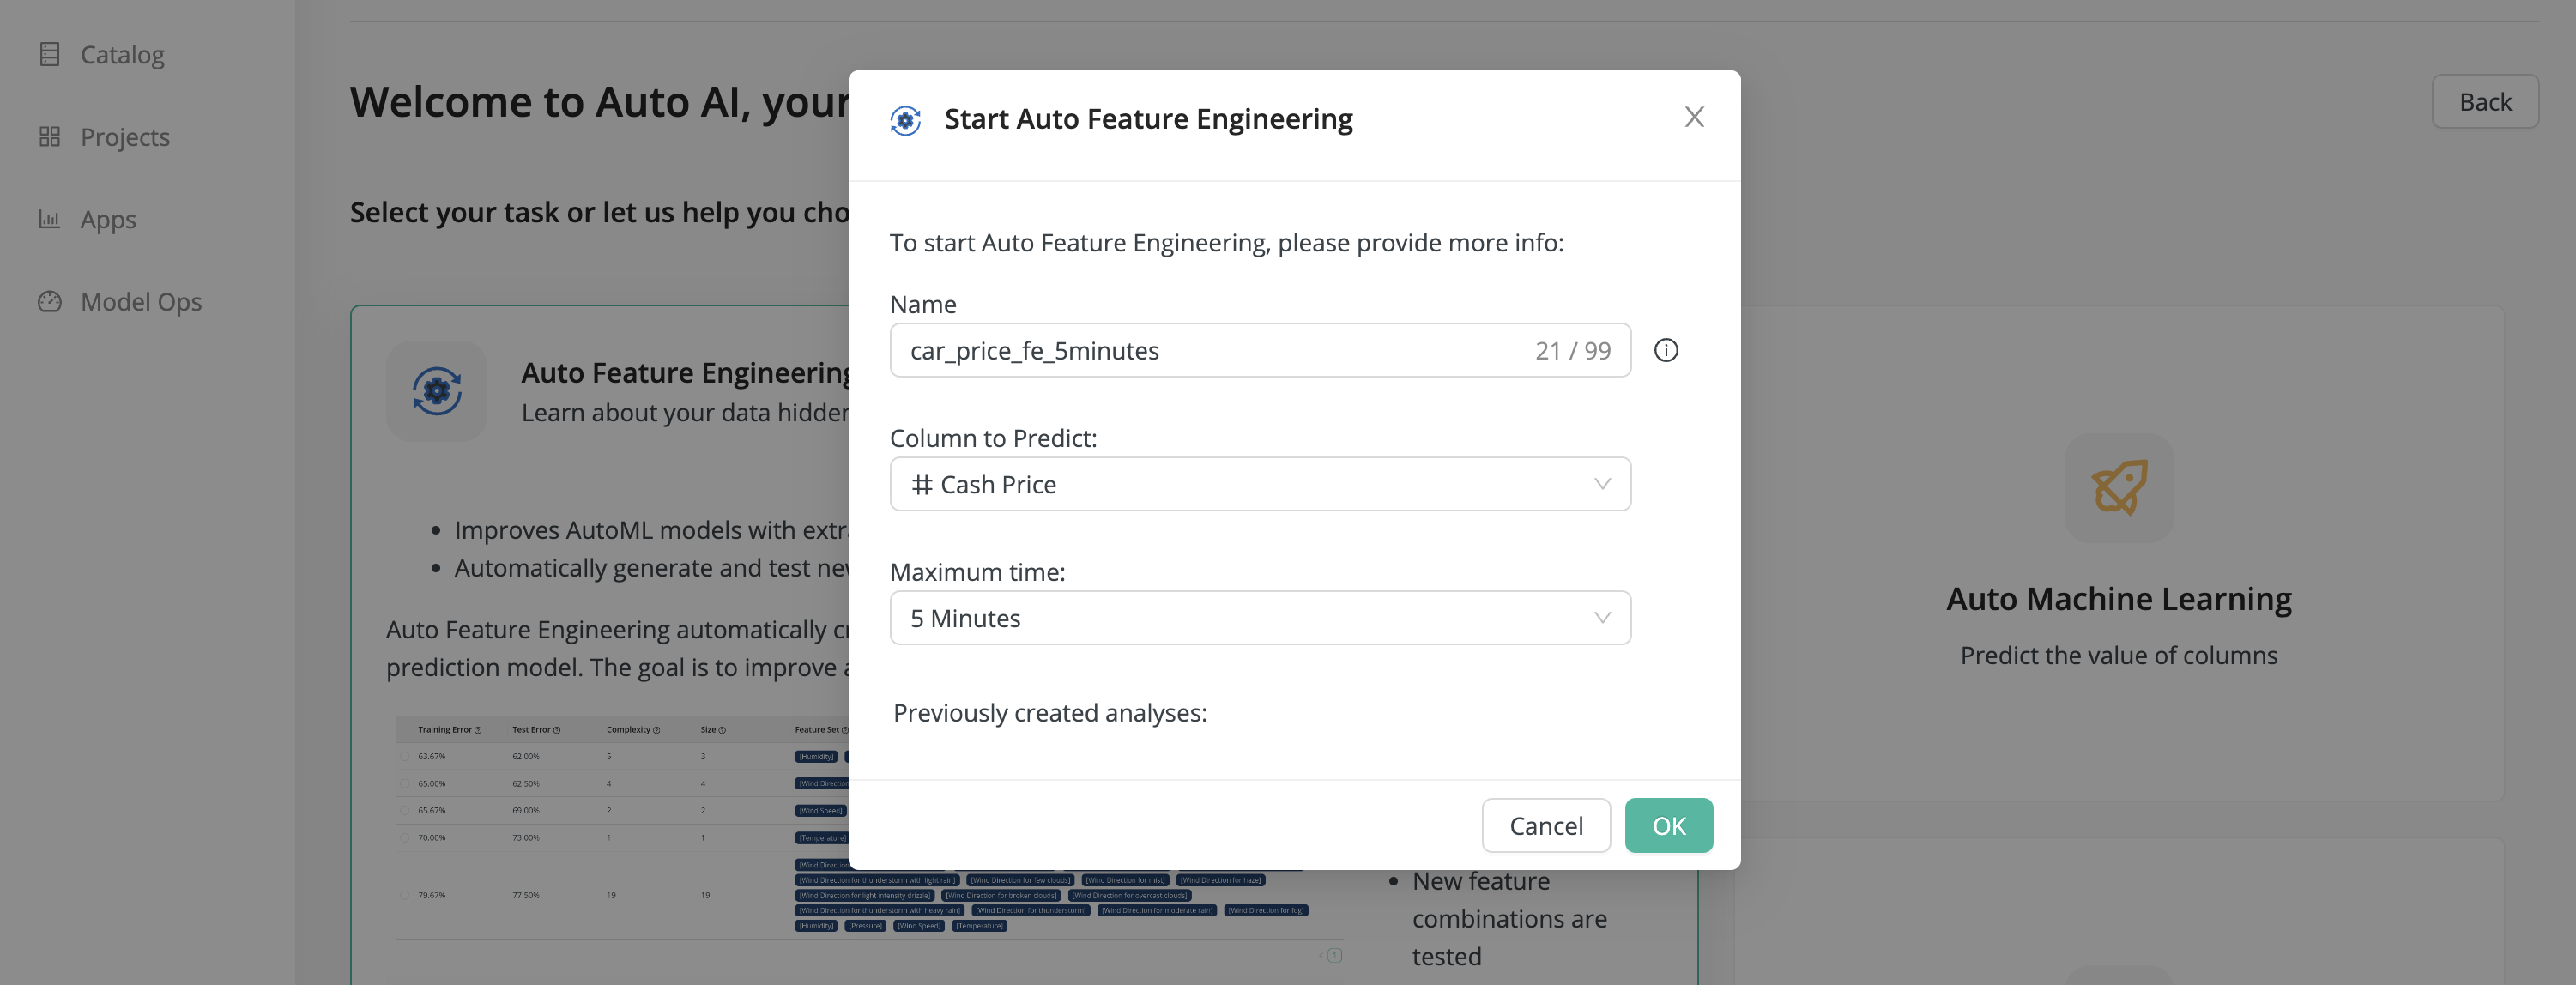
After you press OK, Auto Feature Engineering starts a background job that will run for the time you selected.
Results
Once the analysis is finished, it appears in the Content tab of your project.
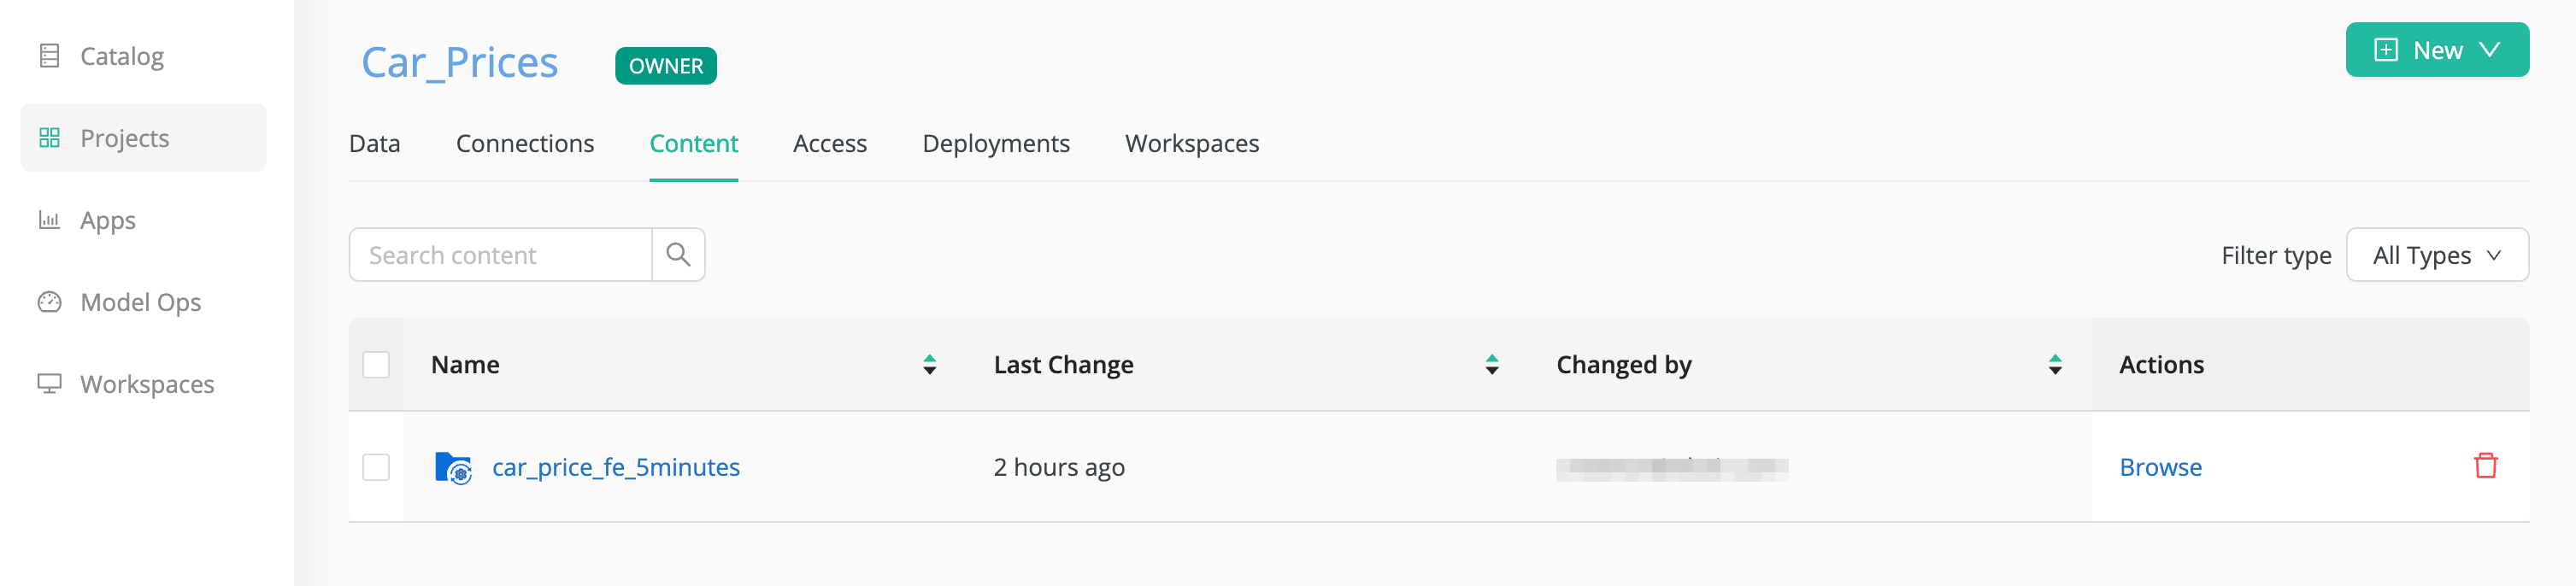
If you click Browse, under Actions, you can get access to the workflow created by Auto Feature Engineering, and you can open it in Workflow Studio.
To see the results, click on the Name.
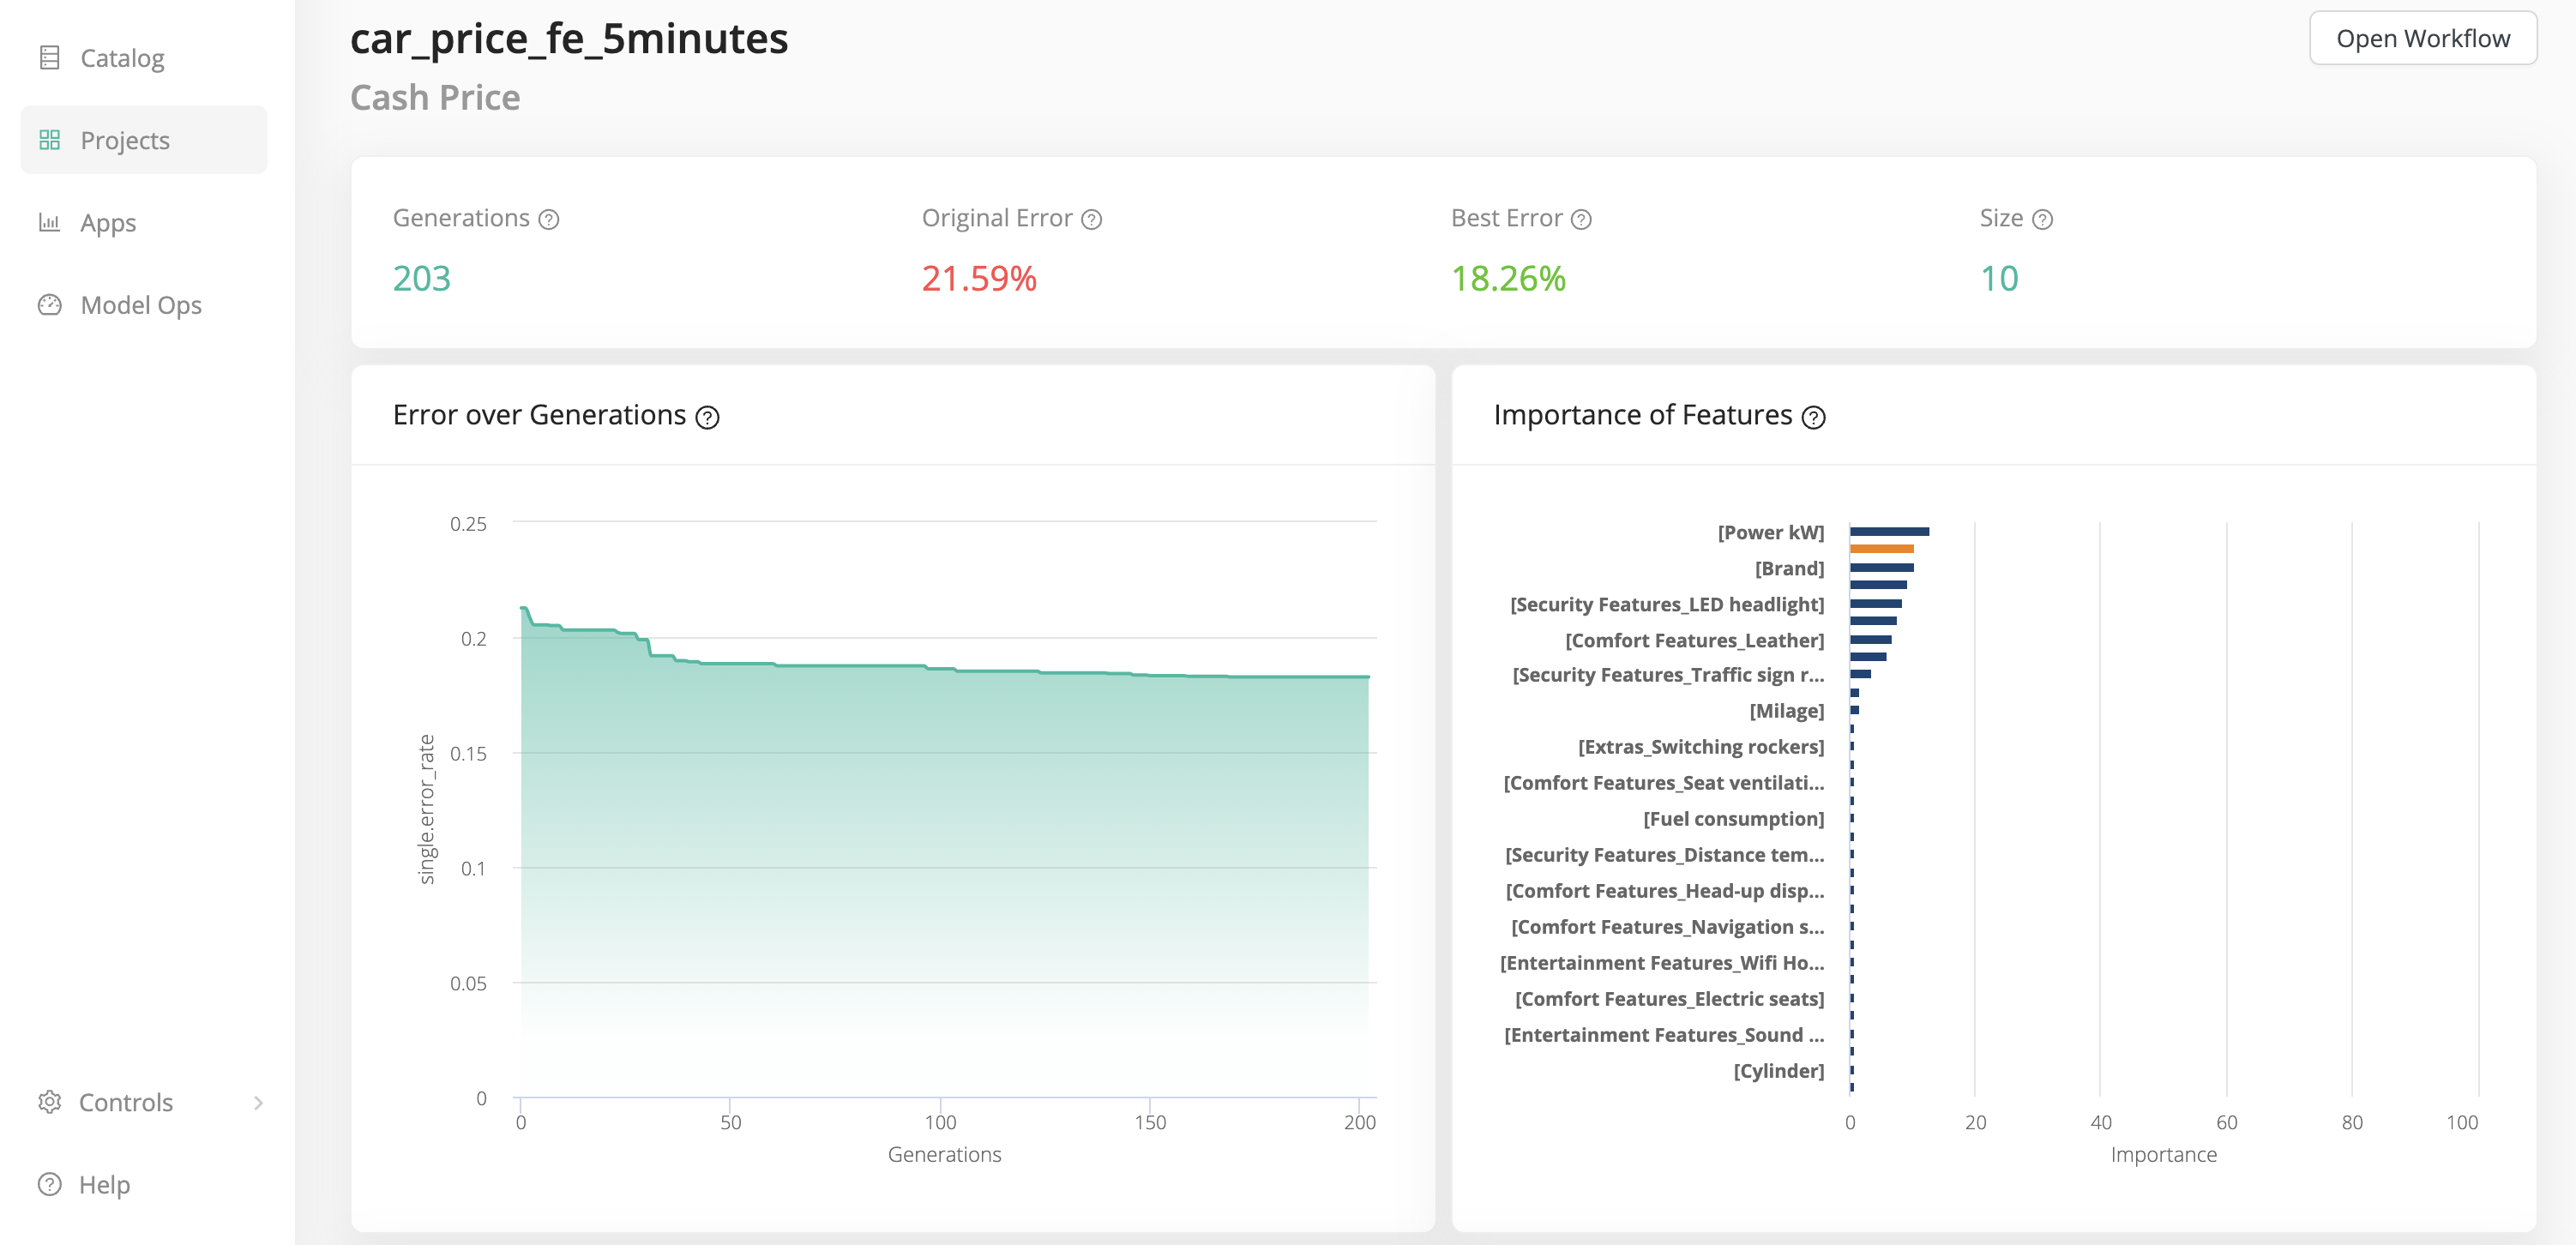
Error over generations
This chart shows the best training error achieved by all feature sets in each generation. An optimization run consists of many generations, and in each generation dozens or even hundreds of feature sets are generated and analyzed. Only the best error rate for each generation is shown here in this chart. But keep in mind that not only the best, but also other promising feature sets will survive into the next generation. Those will be further tweaked to produce even more promising offspring, which then have the potential to outperform the others (survival of the fittest).
Importance of features
This chart shows the frequency each of the features has been used in the optimal feature sets. If one of the features has a bar length of 30, it means it has been used in 30% of all the optimal feature sets. This way you can easily see features which are used in practically all cases versus features which are only useful in specific combinations.
Best feature sets
The list below shows you all the best feature sets that have been produced in the optimization run. Wait, is there more than ONE optimal feature set? Yes, and this is one of the things which makes Auto Feature Engineering so special! You will get not just one optimal feature set, but a complete range of optimal feature sets. Each feature set is optimal in a different sense. Some show the lowest training errors, some only use a few features. This way you can make an informed decision about which feature set to use, finding the optimal tradeoff between error rates and model complexity for your particular use case.
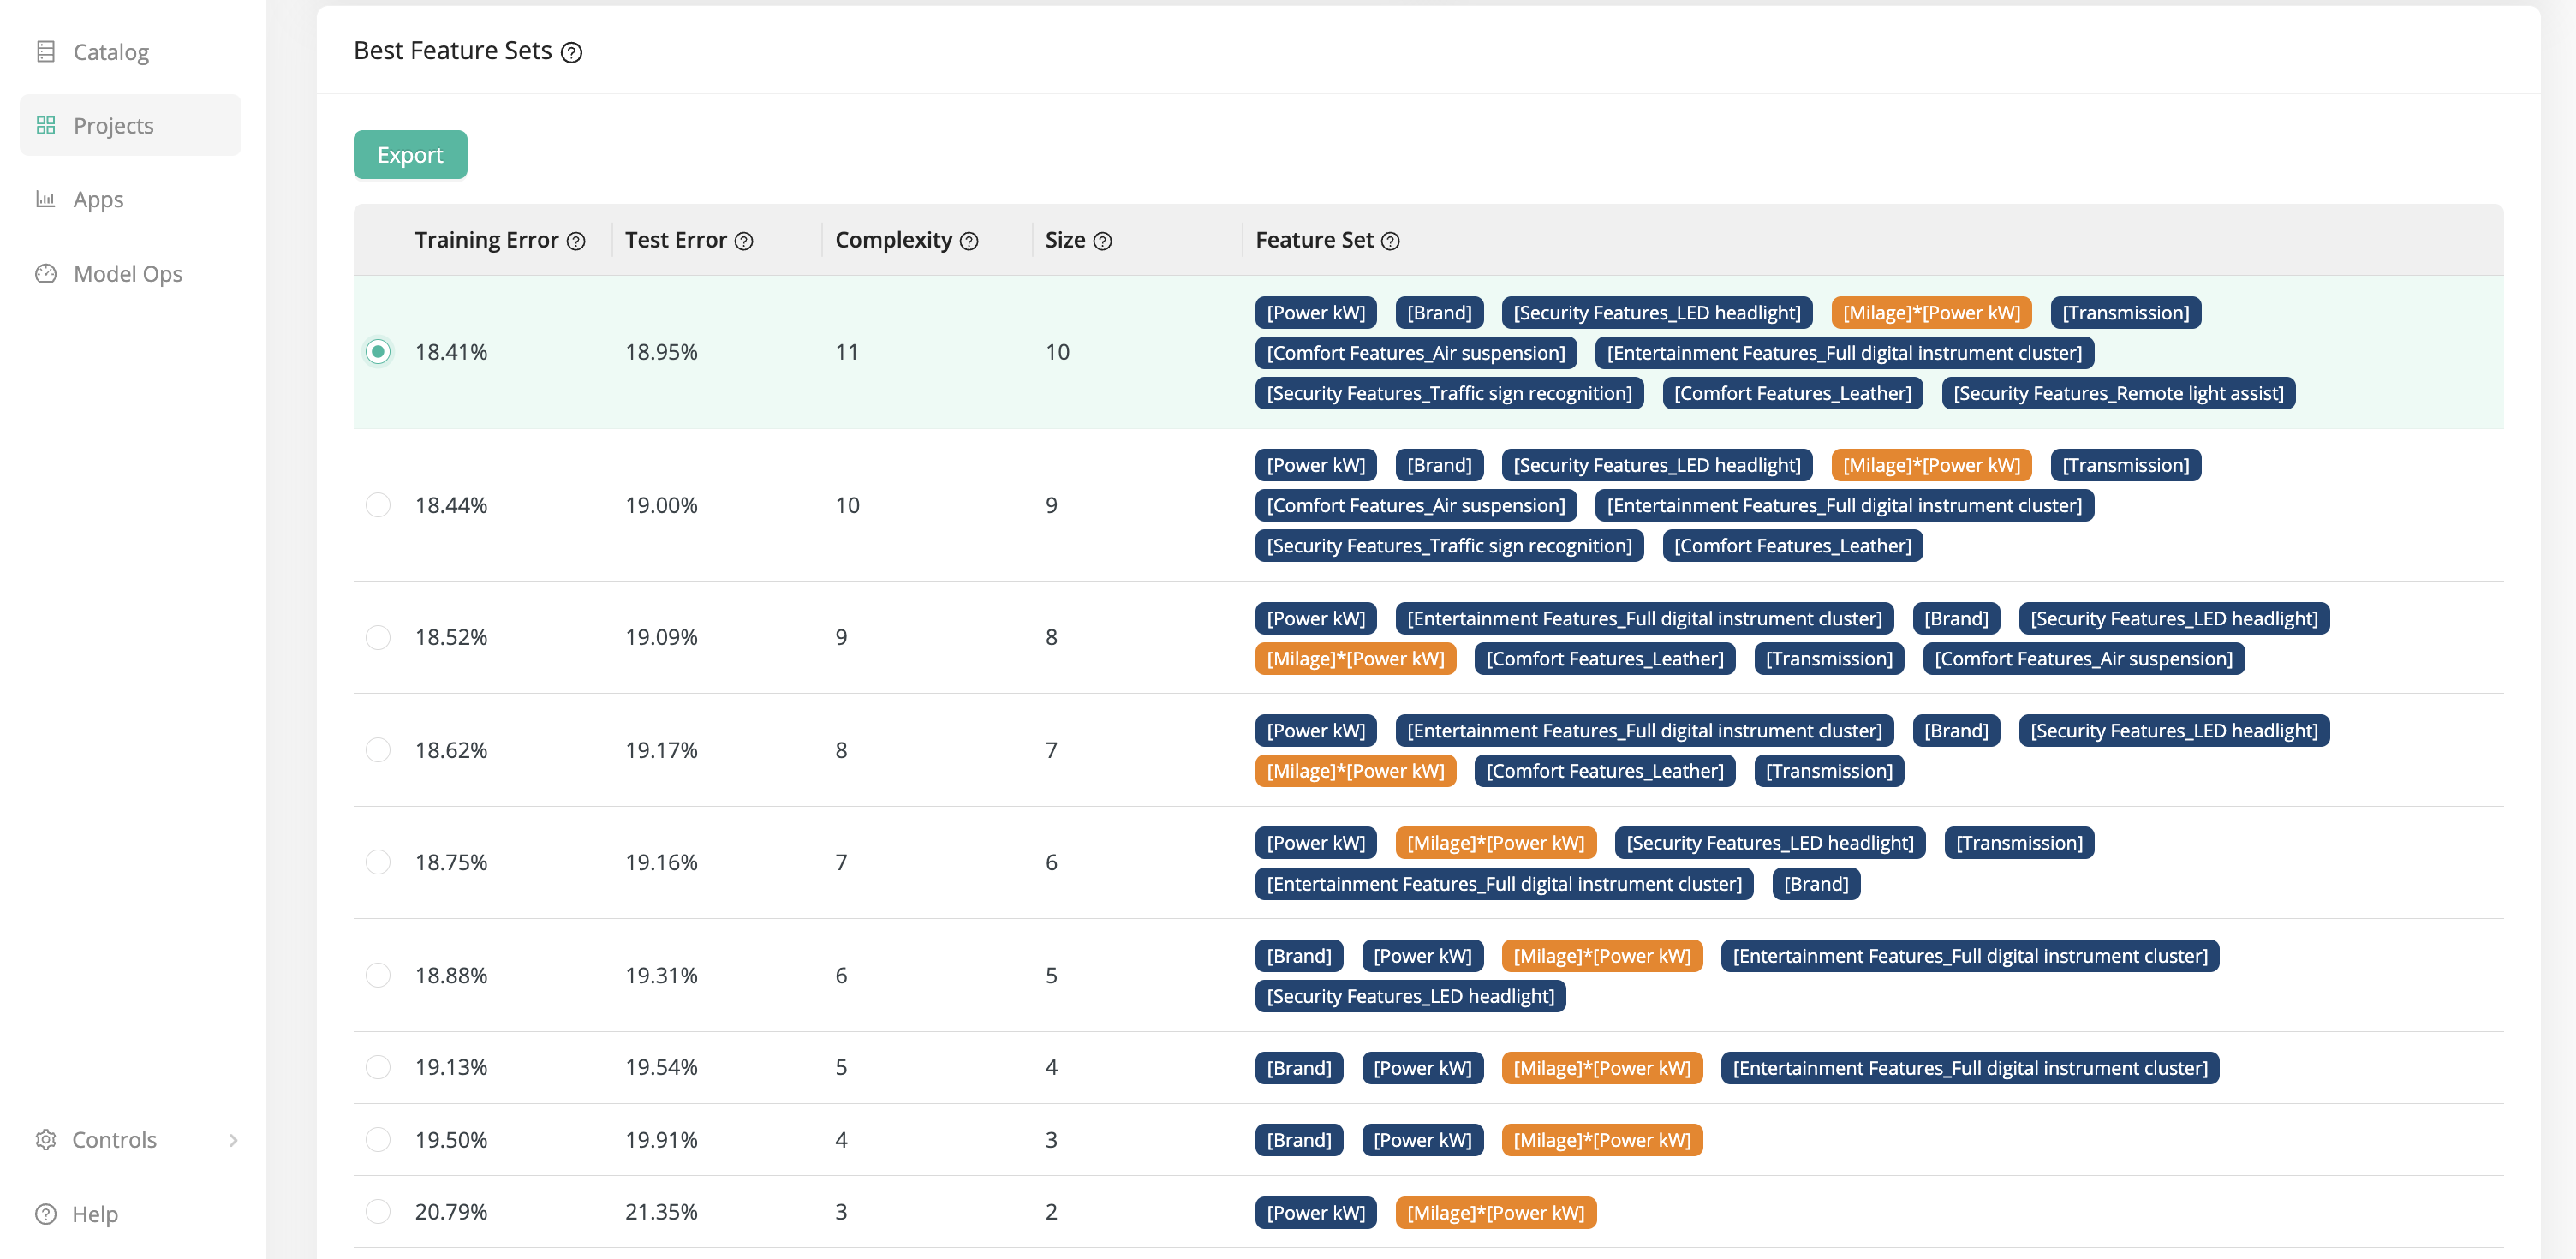
In our example, notice especially two of the feature sets:
-
The feature set with the least training error (18.41%) has 10 features: 9 from the original data set, and one generated feature
[Milage] * [Power kW]. -
With only a slightly worse error rate (20.79%), you can reduce the feature set to only two input variables! The original feature
[Power kW]and the generated feature[Milage] * [Power kW].
Within these two extremes, there is a hierarchy of progressively smaller data sets with progressively larger errors. The smaller feature sets make it clear which are the most relevant features.
Select one of the feature sets and click Export to save it to the Data Assets. From there, you can continue to work on the new data set with Auto Machine Learning or Workflow Studio.