Files
Uploading your data
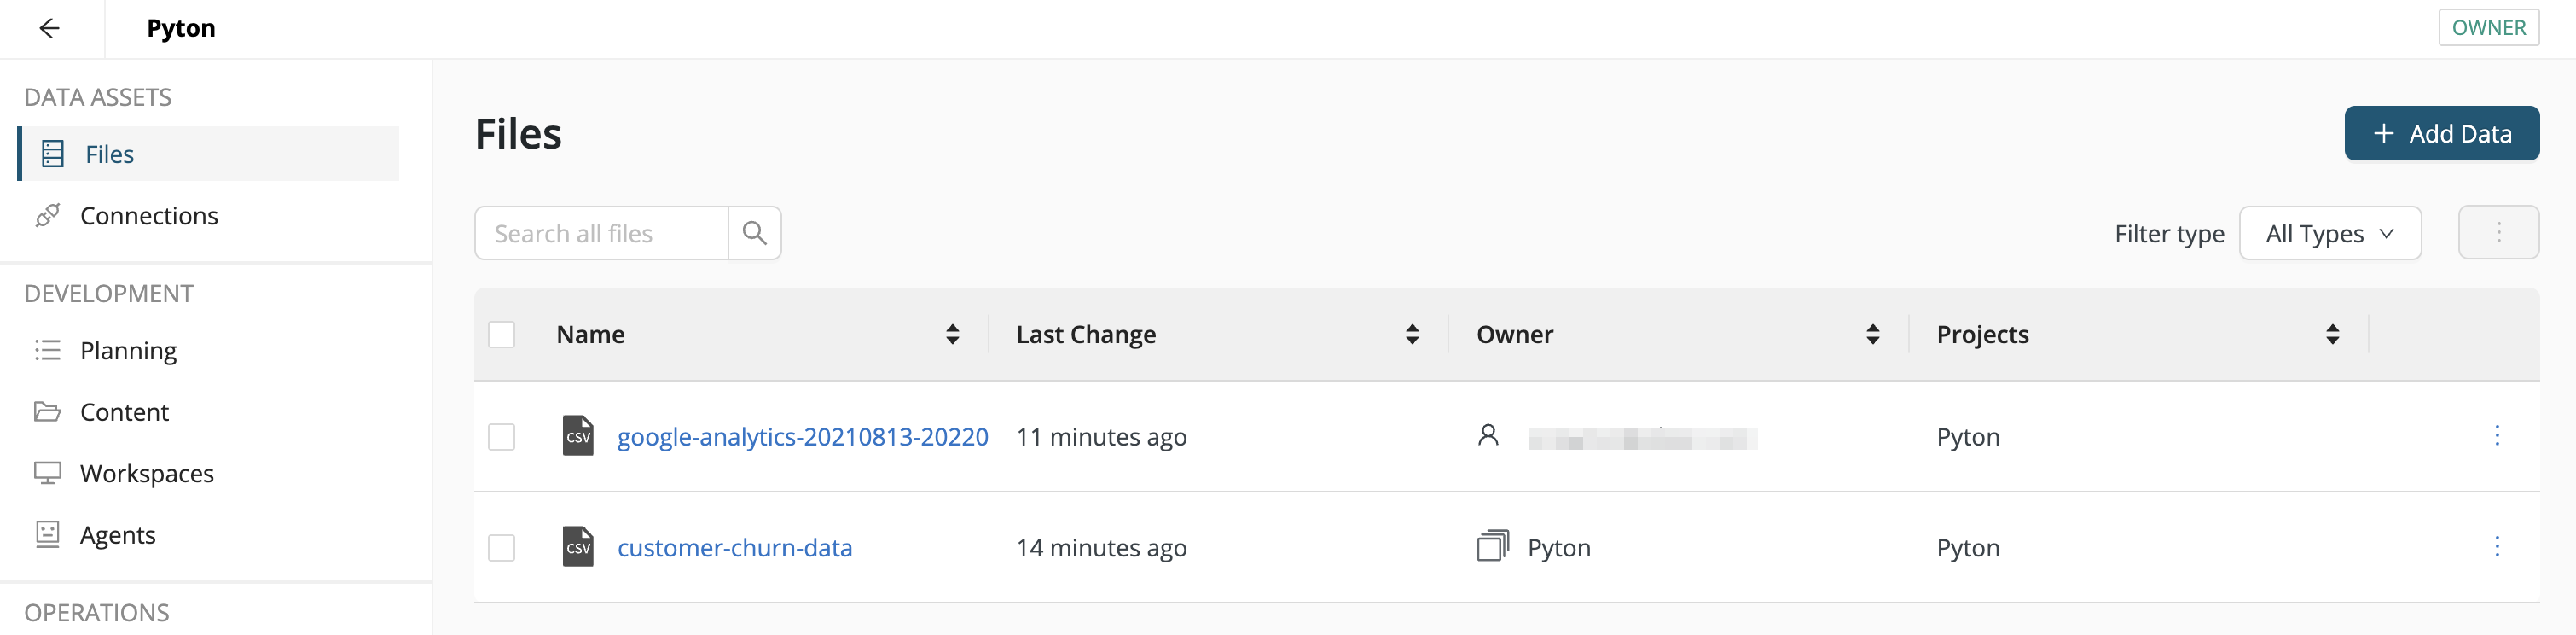
You can upload new data files using the Add Data button found under Data Assets > Files.
- If you add data from within a project, the project is the owner.
- If you add data from within the global view, you are the owner.
Supported formats
You can upload files of any data format to the Data Assets. Nevertheless, we distinguish between two different cases:
- HDF5: The native data file format of Altair AI Cloud. You can find your HDF5 data files in Altair AI Studio in the folder Documents/RapidMiner, with the extension rmhdf5table.
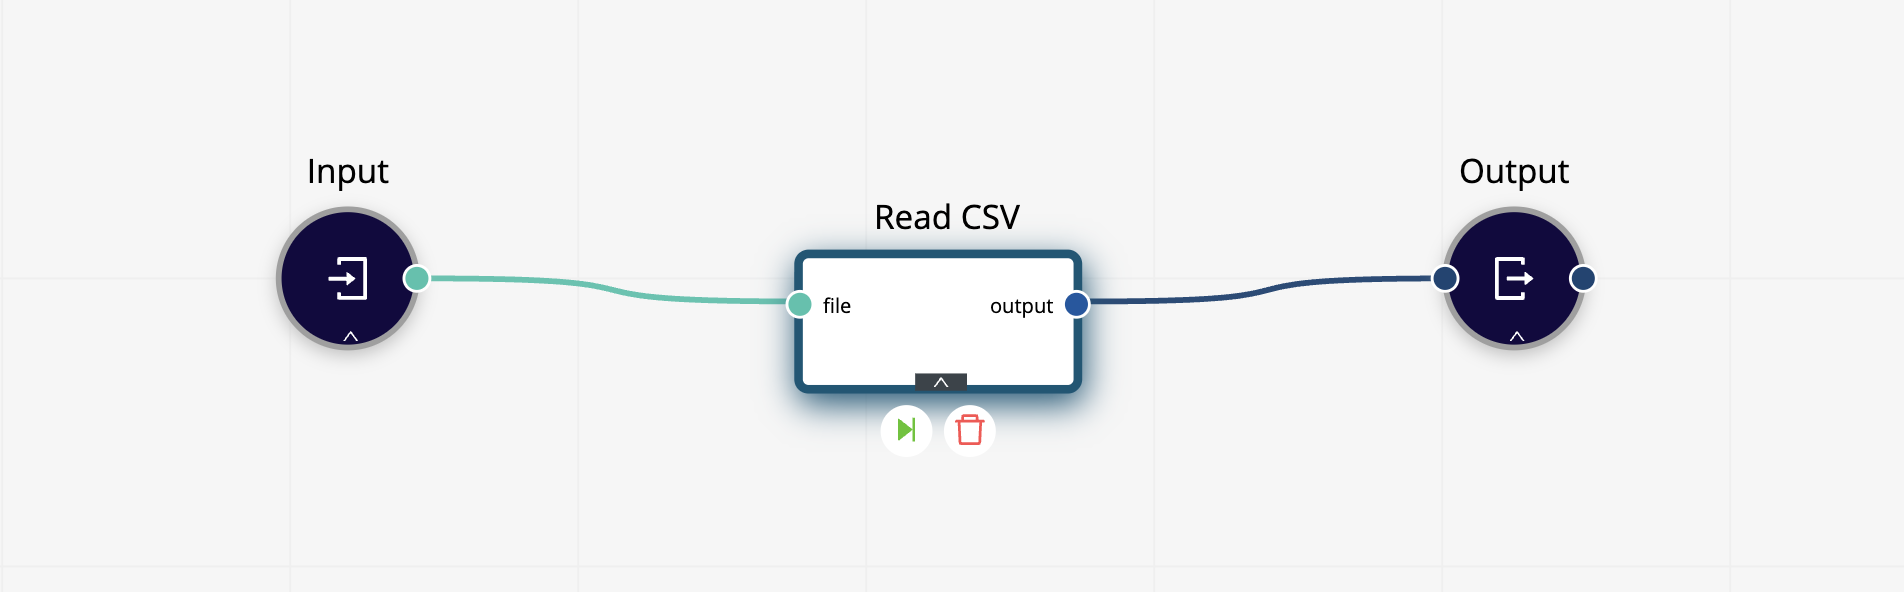
- Other: To use any other data format, such as CSV or Excel, you need to connect the input to the relevant operator in Workflow Studio (e.g., Read CSV).
In practice, the difference is undramatic. It simply implies an extra step when developing your workflow.
Linking data to a project
In order to do anything with a data file, you must first link it to a project.
-
If the project does not exist, create the project.
-
If the project exists, click on the three vertical dots located to the right of the data file, select Link to Project, and then choose a project to which the data should be linked.

- If the data set is generated inside a project, it is automatically linked to this project.
Data linked to a project are available to all project contributors and visible to all project viewers. You may link the same data file to multiple projects.
Other actions
From within Data Assets > Files, you can also perform a number of other actions on single or multiple data sets.
- Link to a project
- Open in Panopticon - Create a visualization in Panopticon
- Download: You can download data sets to a local folder by selecting Download.
- Delete: If you no longer require a data set, you can delete it.
Organizing your data
There are several elements that help you to organize and find your data.
-
Name: A search field allows you to filter by file name, by typing any substring. If you know its name, search is the easiest way to locate a data file.
-
Projects: Knowing which projects the data file is linked to will help you understand where it's used and what its potential dependencies are.
-
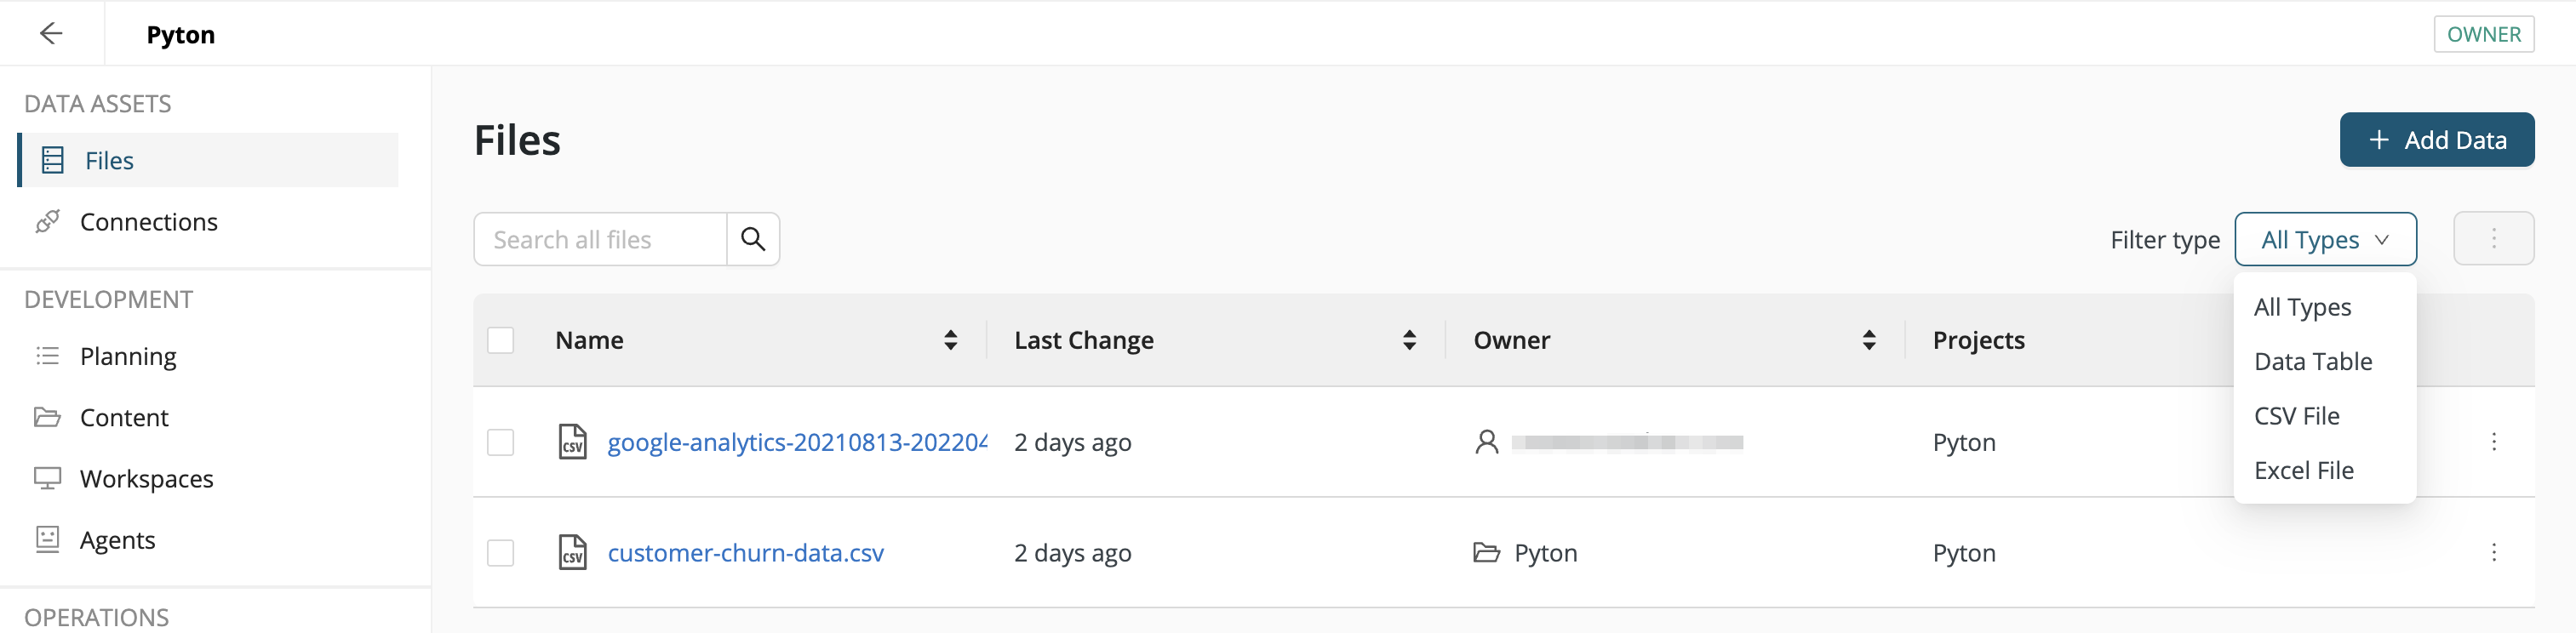
Filter type: The Filter type locates specific file types, such as Excel, CSV, etc.
Viewing data files
The general details and contents of a data file can be viewed by clicking on its name. A number of tabs then give further insight into the data.
- Details - displays metadata for the file
- Data - displays a data table
- Chart - displays the data as a configurable chart
- Statistics - displays basic statistics connected with the data
- Access - allows the data owner to assign access rights
As discussed previously, we distinguish between the native file format (HDF5) for Altair AI Cloud and other formats. Generally speaking, the user interface provides more details for the HDF5 format. Note, however, that you can easily create a workflow to convert a CSV or Excel file into HDF5 format.
| Format | Tabs |
|---|---|
| HDF5 | Details, Data, Chart, Statistics, Access |
| Other | Details, Access |
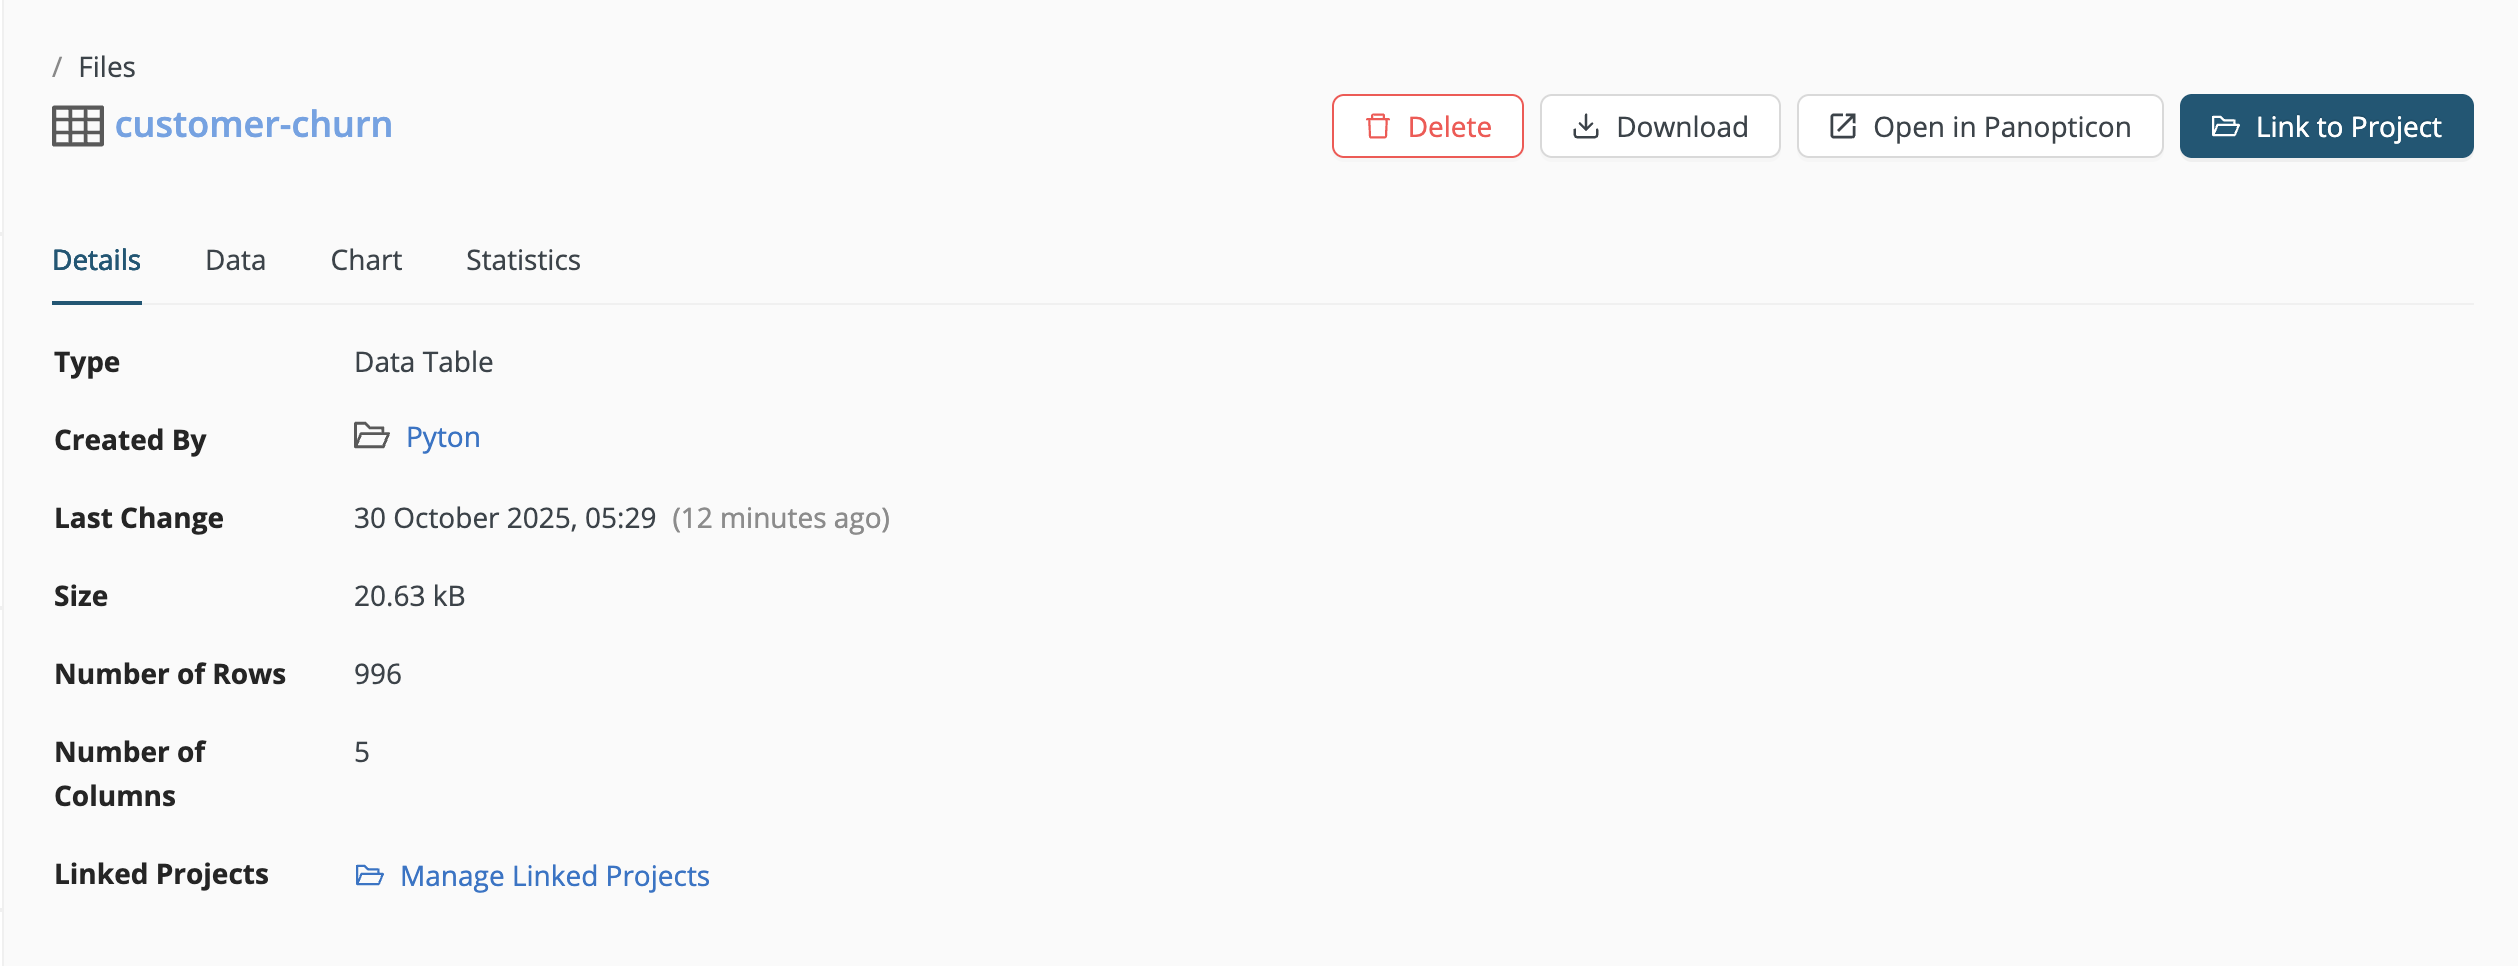
Details
Selecting the Details tab shows the general details of the data set.
Data
When an HDF5 file is selected, the default view of the page that displays next is the Data tab. This page shows you the data set in tabular form, including:
- all column names and data types and
- an indicator of the ratio of missing values in a column.

When the chart icon next to a column name is selected, a popup displaying a plot of the data appears.
![]()
This plot can be customized via the Chart tab by clicking Open visualization at the bottom of the popup.
Chart
You can create basic and more advanced charts for a data set by selecting the Chart tab.
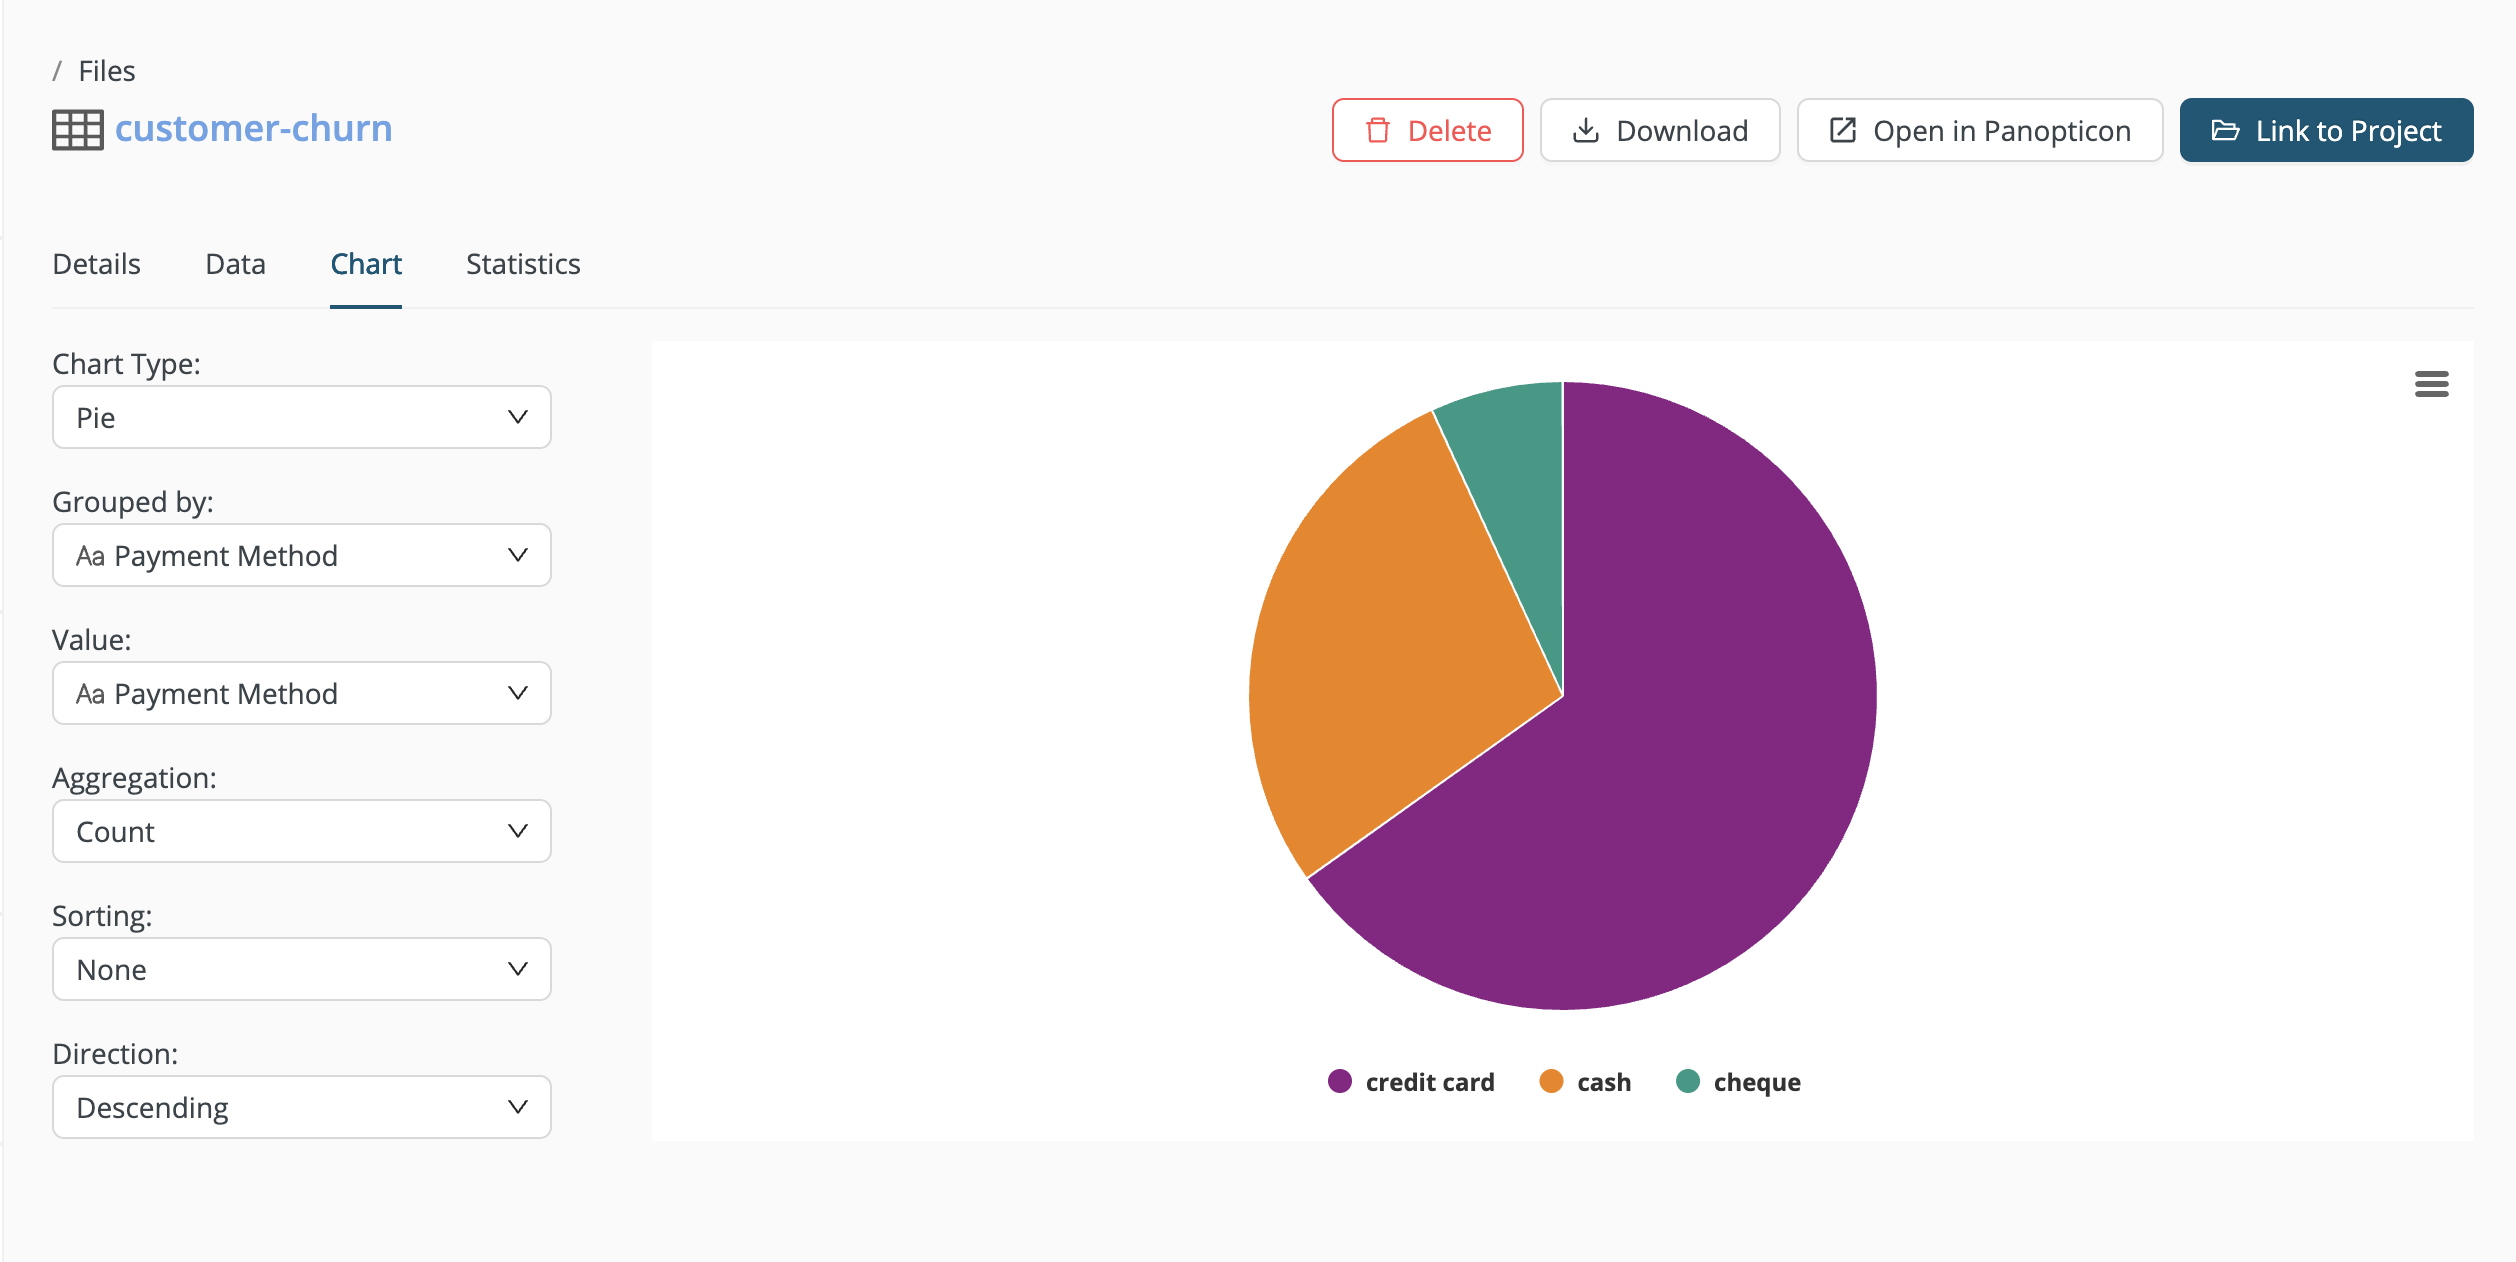
When visualizing your data set, you can:
-
Choose from many available chart types.
-
Customize the chosen chart type.
-
Zoom into the chart area to have a closer look into certain parts.
-
From the menu icon on the chart, you can export the chart in various formats, including JPEG, PDF, PNG, and SVG.
Statistics
Clicking on the Statistics tab brings you to the Statistics page.

Here you can identify missing values and analyze basic type-dependent statistics for each of the columns in your data set, such as:
-
earliest and latest dates and duration;
-
min, max, average, and standard deviation; and
-
least- and most-common values.
Click on values to identify duplicate or unique values, or get a count of each value in a column.
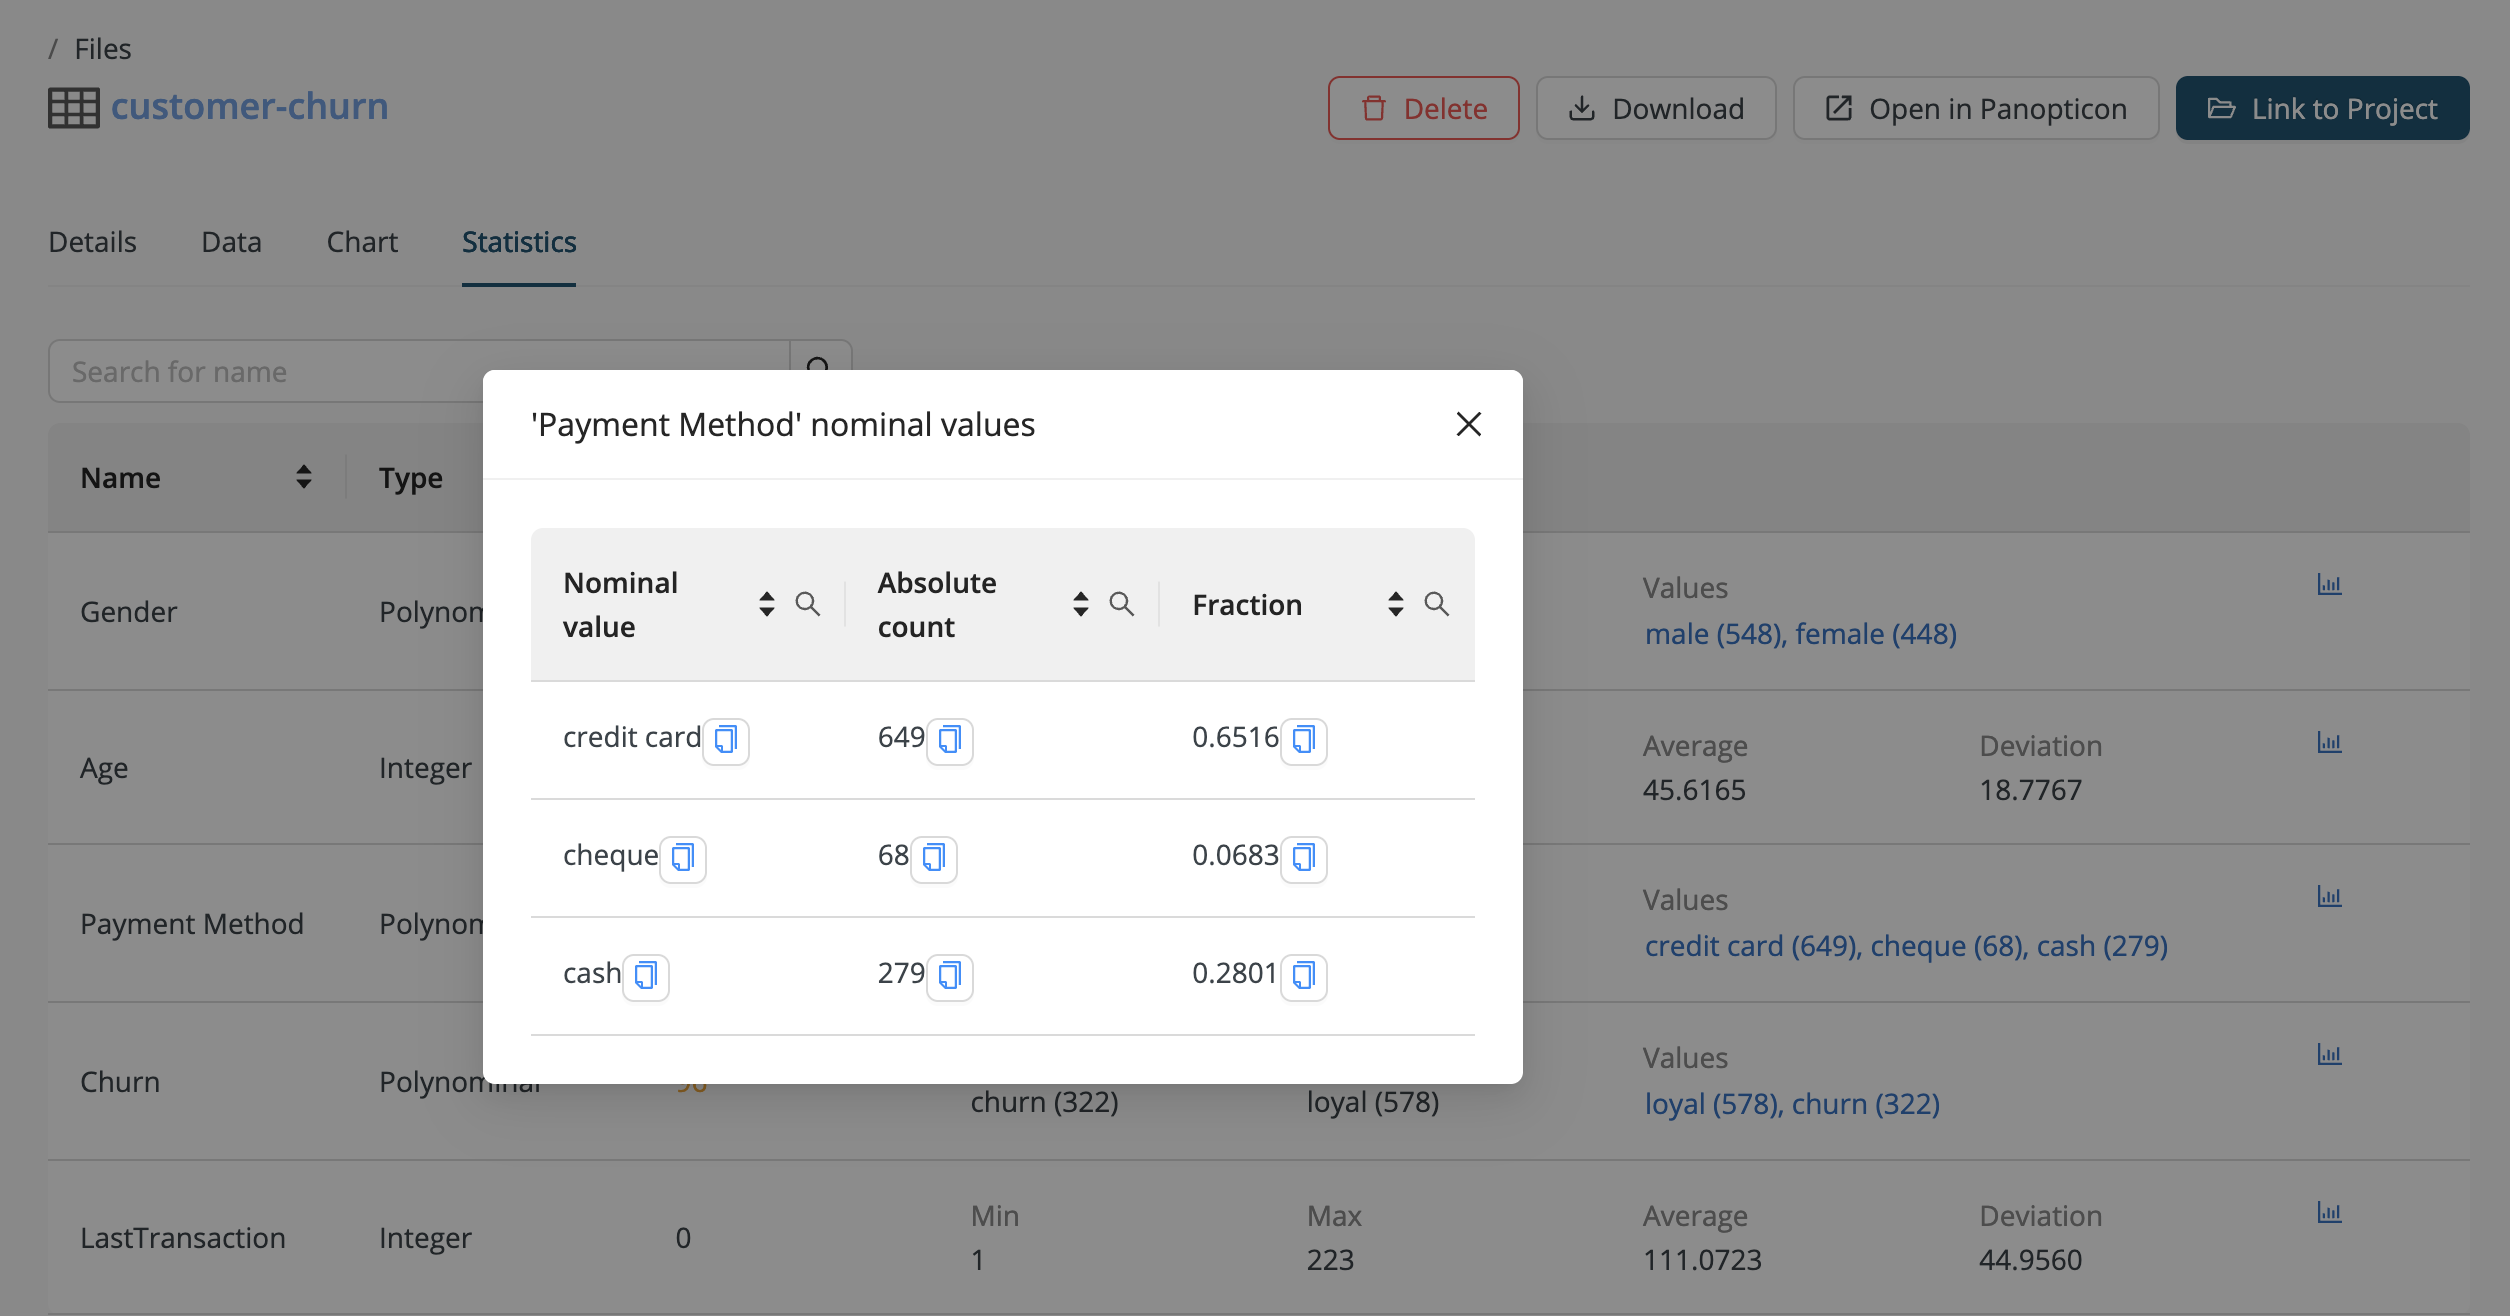
Click the chart icon at the end of a row to see a basic visualization of the values in the column. For more detailed charts, see the Chart tab.
Access
If the data file is linked to a project and a user has access to the project, that user does not need additional permissions to use the file in the same or other projects.
When a data file is not owned by a project, the Access tab appears. Here, you can click Add User and specify access permissions for the file:
- Read (read only) or
- Write (read-write).

Other files
When other data file types such as CSV or Excel files are selected, their Details display in a new page as the default view, but the Data, Chart, and Statistics tabs are not available.
