Inspect models
Results
In the first 4 steps of Auto ML, you may have clicked your way through. Now you need to slow down and assert your expertise. At first sight, the results may seem overwhelming, so don't lose sight of the purpose:
-
to help you identify the most useful models (see Performance metrics and Model comparison)
-
to help you better understand your models and data (see Weights and Model Simulator)
-
to [make predictions] (predict.md), after you have completed steps (1) and (2)
If you're looking for a user-friendly starting point, have a look at the Model Simulator.
While it may be tempting to treat your model as a black box, plug in new data, and make a prediction, the output of a black-box prediction can be misleading -- see the summary of the Churn example.
Performance metrics
To say whether a model is good or bad, and in particular whether it is better or worse than some other model, we need to have some basis of comparison. By assigning a numeric measure of success to the model, a so-called performance metric, you can compare it with other models and get some idea of its relative success.
The complication is that many different performance metrics exist, and none of them is absolute as a standard of success; each has strengths and weaknesses, depending on the problem you're trying to solve. You will have to choose the best performance metric for your problem, and with the help of this performance metric, you can choose the best model.
Recall from 2. Choose column that the type of problem you're solving depends on the values in the target column. Are they categorical or numerical? Depending on what you're trying to predict, there are different performance metrics. For a more detailed discussion, including examples, see the links below:
- 5A. Binary classification (categorical data, two possible values)
- 5B. Multiclass classification (categorical data, three or more possible values)
- 5C. Regression (numerical data)
Test sets
In order to calculate the performance metrics, we start by building a model based on a random sample of 60% of your data (the training set). The remaining 40% will be used as a holdout set, to ensure that we measure model performance based on data that's not been seen by the model, thus getting more unbiased, realistic results.
We further divide the holdout set into 7 disjoint subsets (called the test sets). Auto ML will apply every model separately to get prediction, then compares with the known values (called actuals). We discard the lowest and highest performances, and calculate the average of the remaining 5 test sets. This validation method, although not as thorough as a full cross-validation, but it strikes a good balance between runtime and model validation quality. Ideally there should be no difference between prediction and known value, but in practice there usually is, because the predictions are rarely 100% correct. If the predictions are 100% correct, you should be suspicious: perhaps one or more of the input columns are highly correlated with the target? Take a look at those columns and make sure that those inputs are available prior to the prediction.
Model comparison
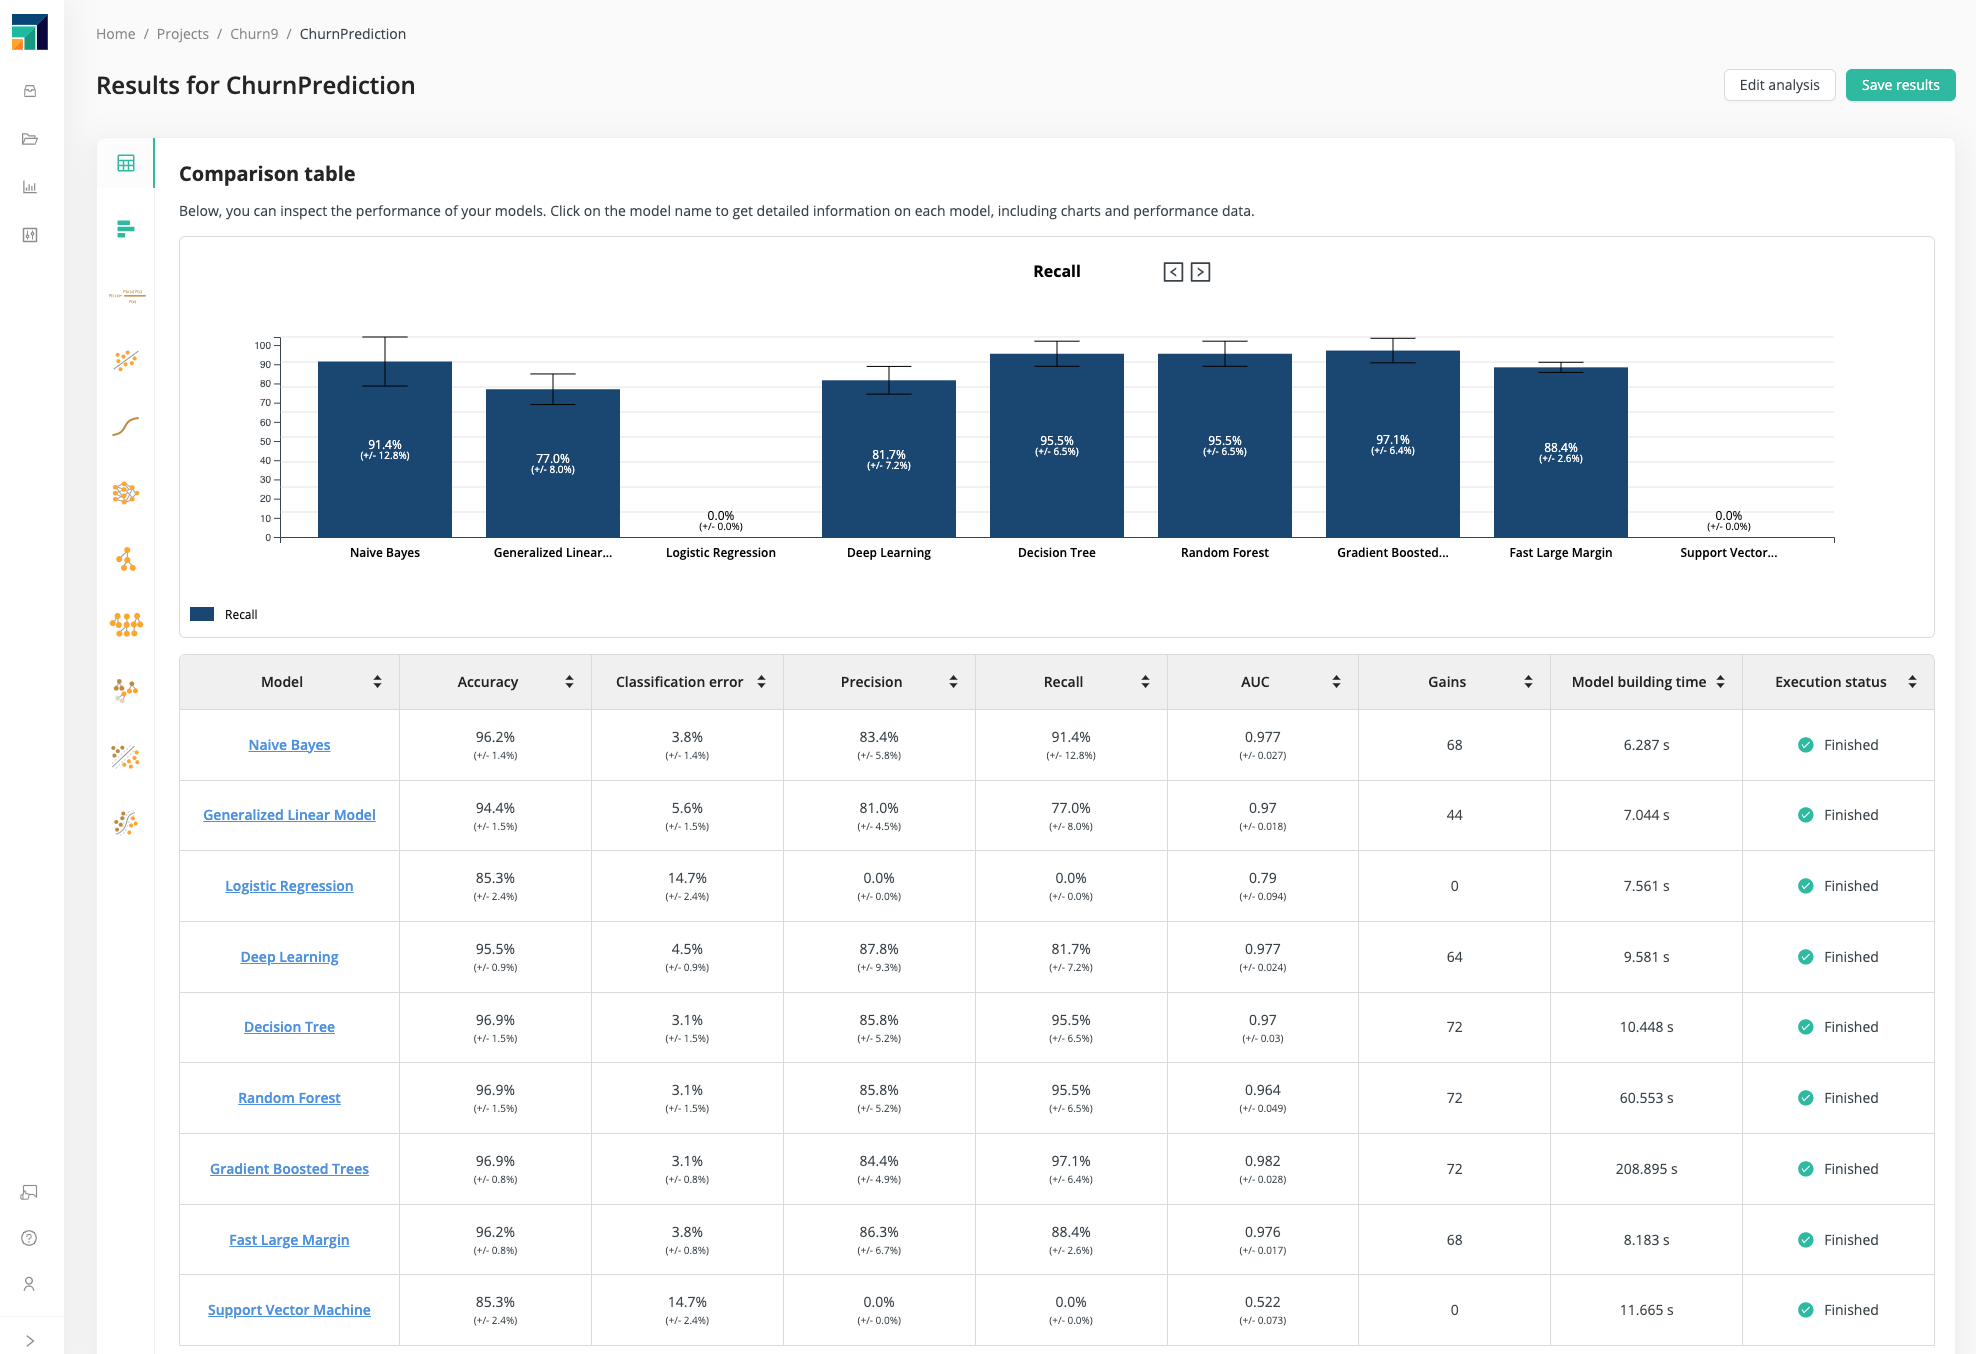
Once you have chosen a performance metric, you can use the model comparison to help you find the best model, according to that metric.
The model comparison displays the performance of each model:
- as a bar chart, for any particular performance metric, comparing the models head-to-head
- as a table, with models as rows and performance metrics as columns
Click on a performance metric to display the bar chart for that metric. Click on a model to learn more about the details of that model. As discussed in 5A. Binary classification, Recall is the most useful metric for the Churn Prediction Data, and according to that metric, the models with the best performance are Decision Tree, Random Forest, and Gradient Boosted Trees.
Weights
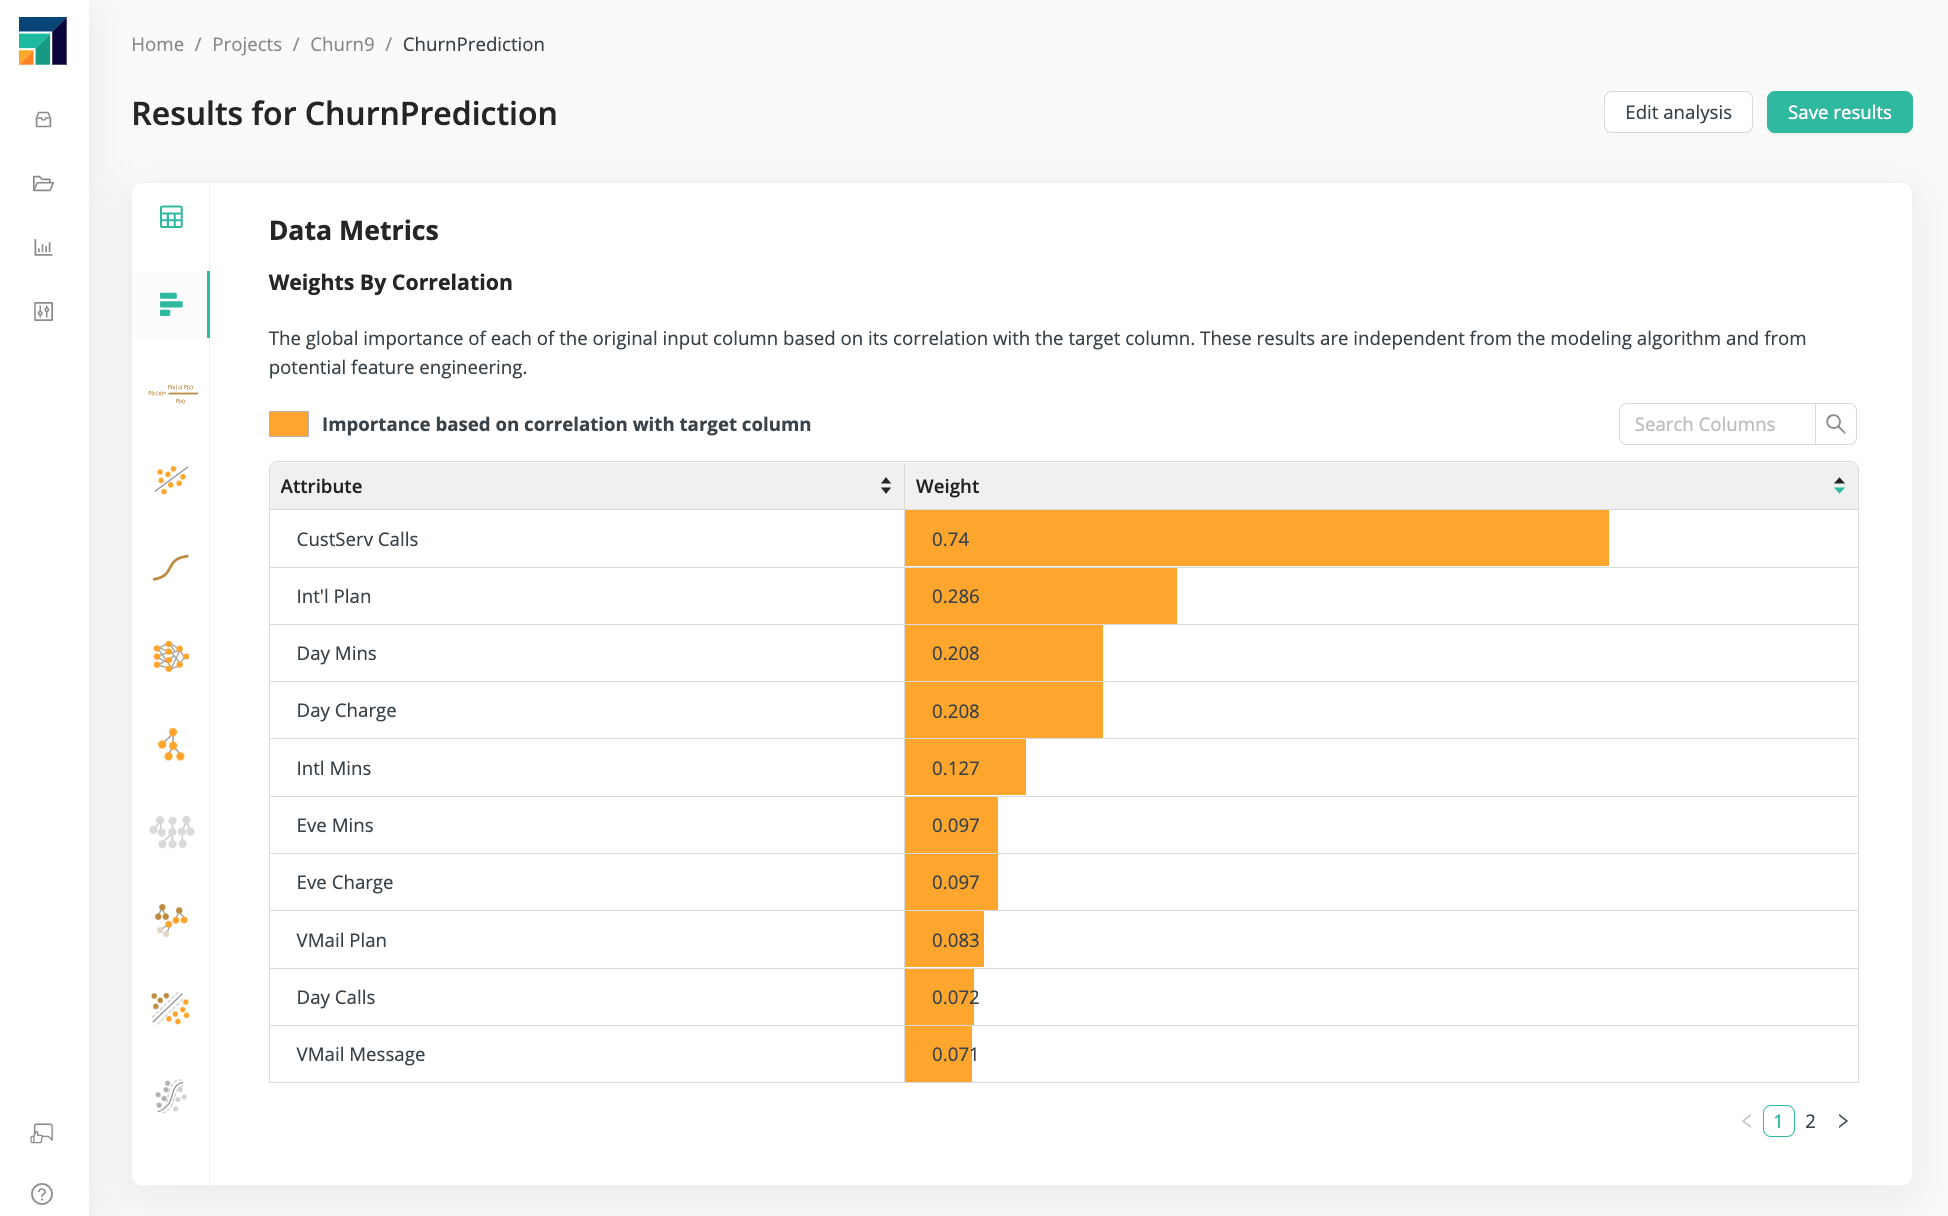
Click on the Weights icon to learn more about your data, independent of the model.
The Weights tell you which input data is mostly likely to affect the prediction.
From 3. Select inputs, we knew already that CustServ Calls
was the most important column in the Churn Prediction Data.
The Weights show that Intl Plan, Day Mins, and Day Charge
are the next most important columns, although their weight is much less.
In the Model Simulator, change the values of the input data with the highest weights, and you will quickly understand the importance of that data. Input data with a lower weight is less likely to have an impact.
Continue with the Example: Churn Prediction Data