Build models
Auto ML is designed to help you build predictive models from your data – fast and simple. All you need is a data set and something you want to predict. It's that simple!
As discussed in the introduction, we will guide you through the following steps:
- Start Auto ML -- Assuming you have a data file in rmhdf5table format linked to a project, select Start Auto ML.
- Choose Column -- choose the column whose values you want to predict
- Select Inputs -- decide what's relevant and eliminate what's irrelevant
- Select Models -- select and build one or more models
By the end of step (4), you will have created one or more models. After that, you can inspect the models and decide which one best suits your purpose.
Step 1: Start Auto ML
To follow the documentation step by step:
The use of Auto ML presupposes that:
-
you have a data file in rmhdf5table format
If you want to use your own data set, but it's not in rmhdf5table format, you should first convert it. For example, the Read CSV operator reads a CSV file and the resulting output will be in rmhdf5table format.
-
and that file is linked to a project.
From within the Content tab of the project, select Auto AI and then Auto Machine Learning.
Step 2: Choose Column
In what follows, we'll discuss the consequences of choosing the sample data set ChurnPredictionData. The data concerns customers of a phone company, who may or may not give up on their subscription.
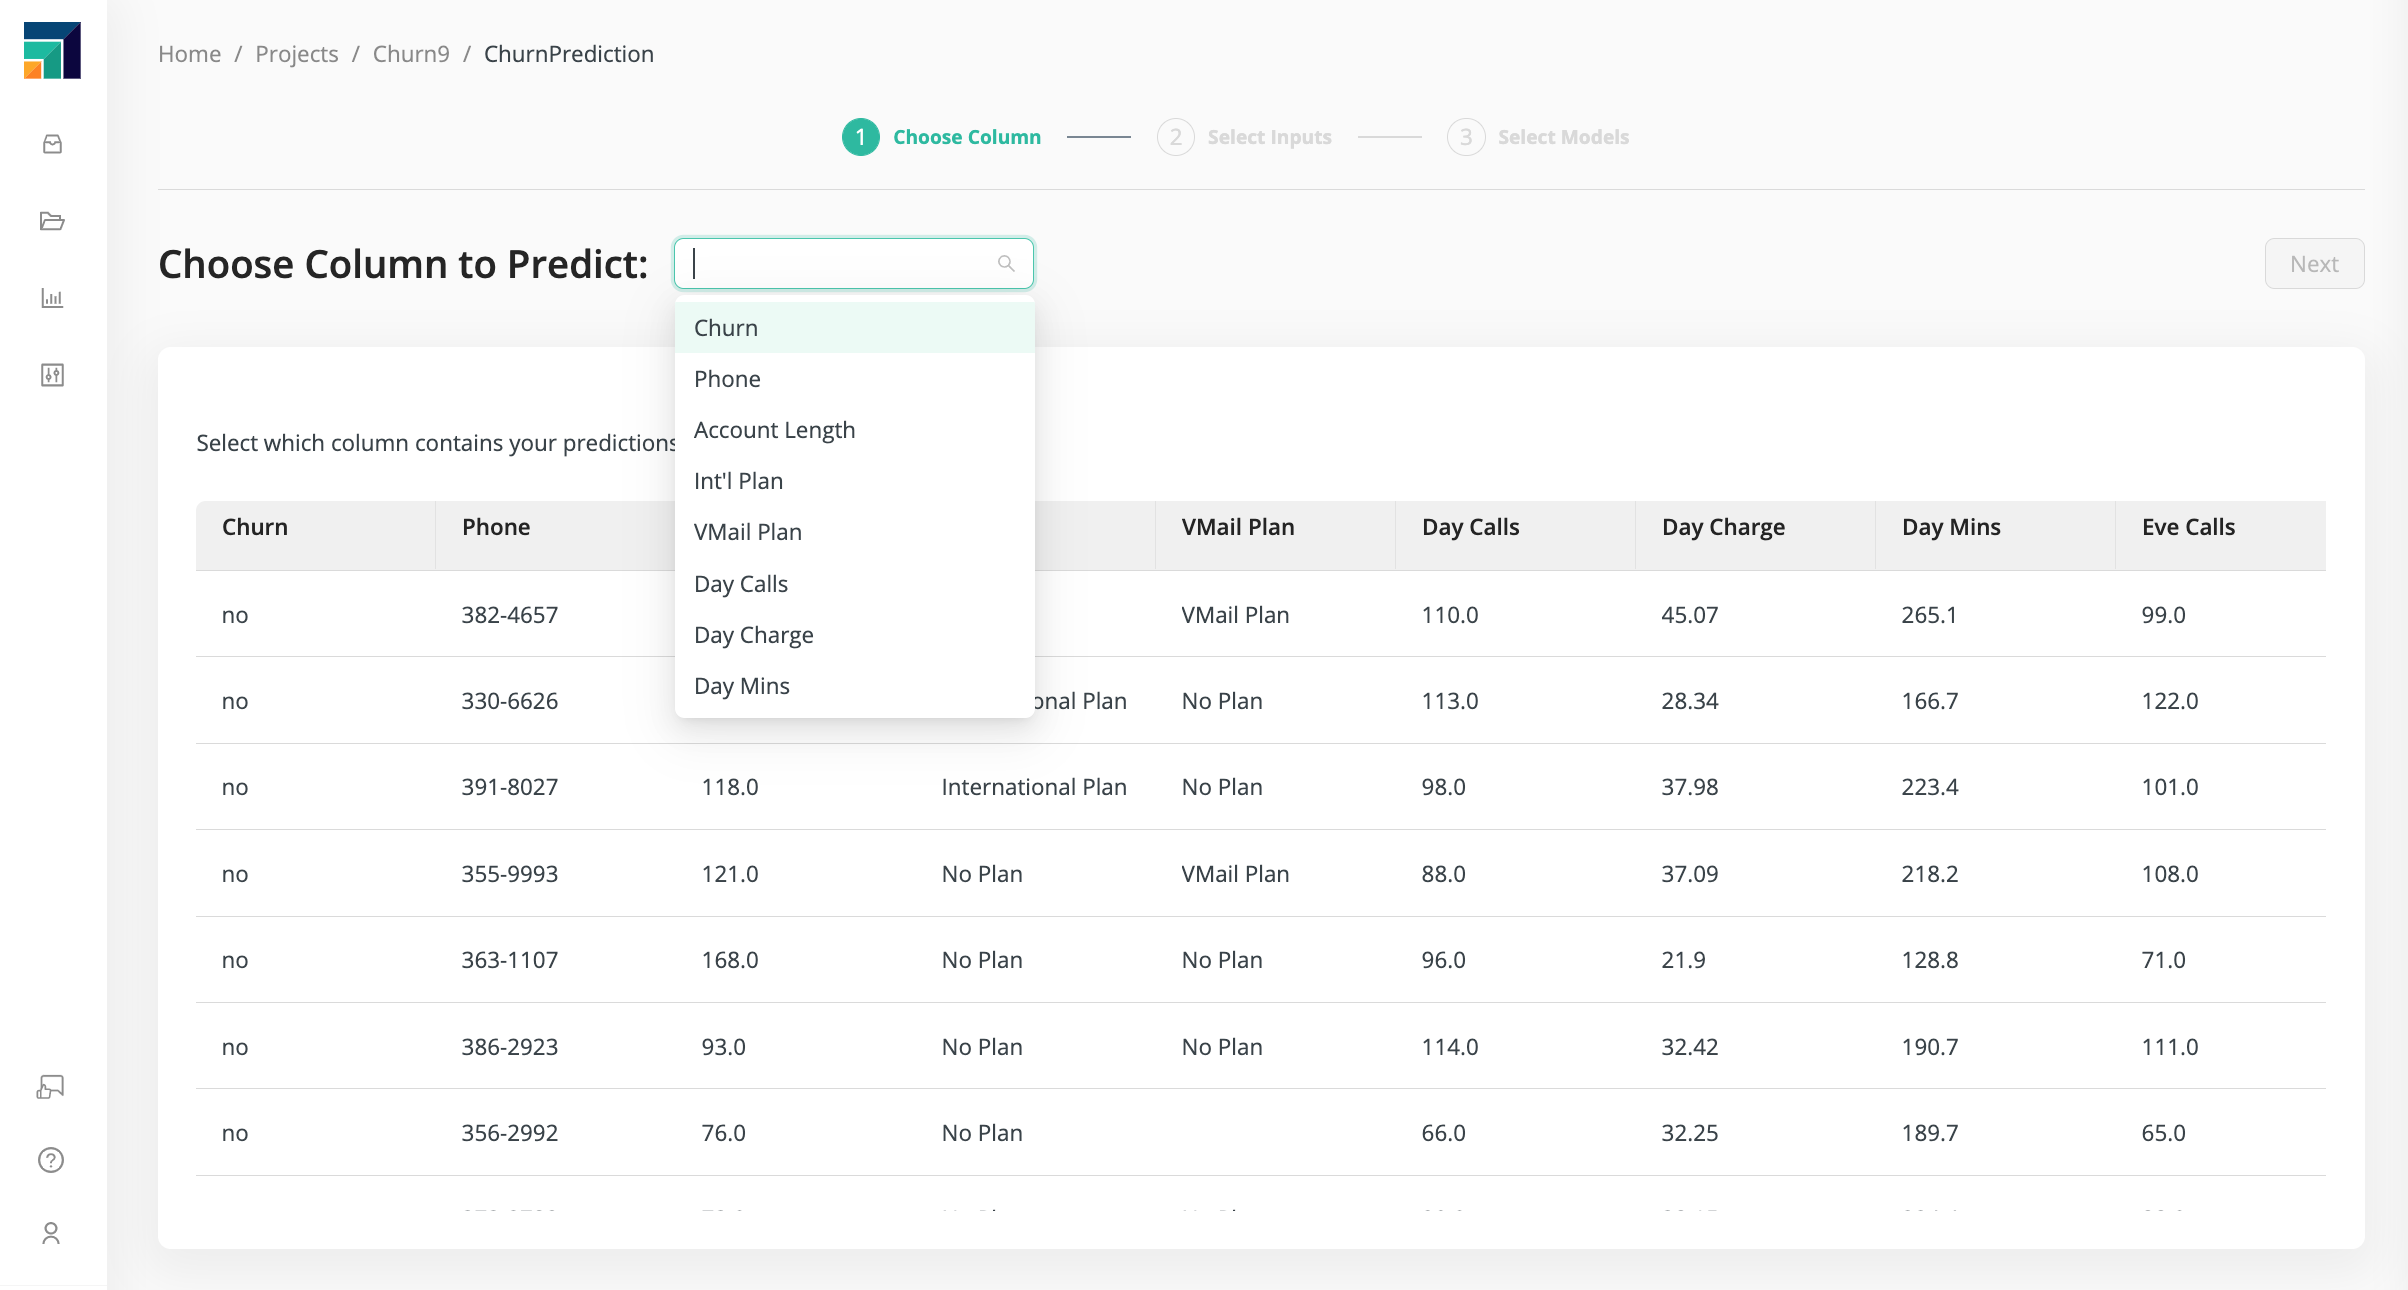
One of the data columns -- we'll call it the target column -- has values that you want to predict.
In our current example, the target column is Churn, since we want to predict who will churn.
From the dropdown menu, choose Churn before clicking Next.
In general, the values of the target column can be numerical (like CustServ Calls) or categorical (like Churn).
Depending on your target column, the problem will fall into one of the three following categories:
- Binary classification - Categorical data, two possible values (like
Churn) - Multiclass classification - Categorical data, three or more possible values
- Regression - Numerical data (like
CustServ Calls)
Choose a column, and Auto ML will automatically detect what type of problem it has to solve. Additional details for for each type of problem are given below.
-
Binary Classification (predicting one of exactly two possible values)
Some questions have a yes-or-no answer. For example, if you take a medical test, the results are often described as positive or negative:
- Positive : the test found what you were looking for (e.g., an infection)
- Negative : the test did not find what you were looking for (e.g., no infection)
If the result is positive, a more thorough investigation may be necessary; if the result is negative, no more work is needed. Arguably, the positive result is more important and deserves a higher degree of attention, because the focus of medical work is to treat the infection.
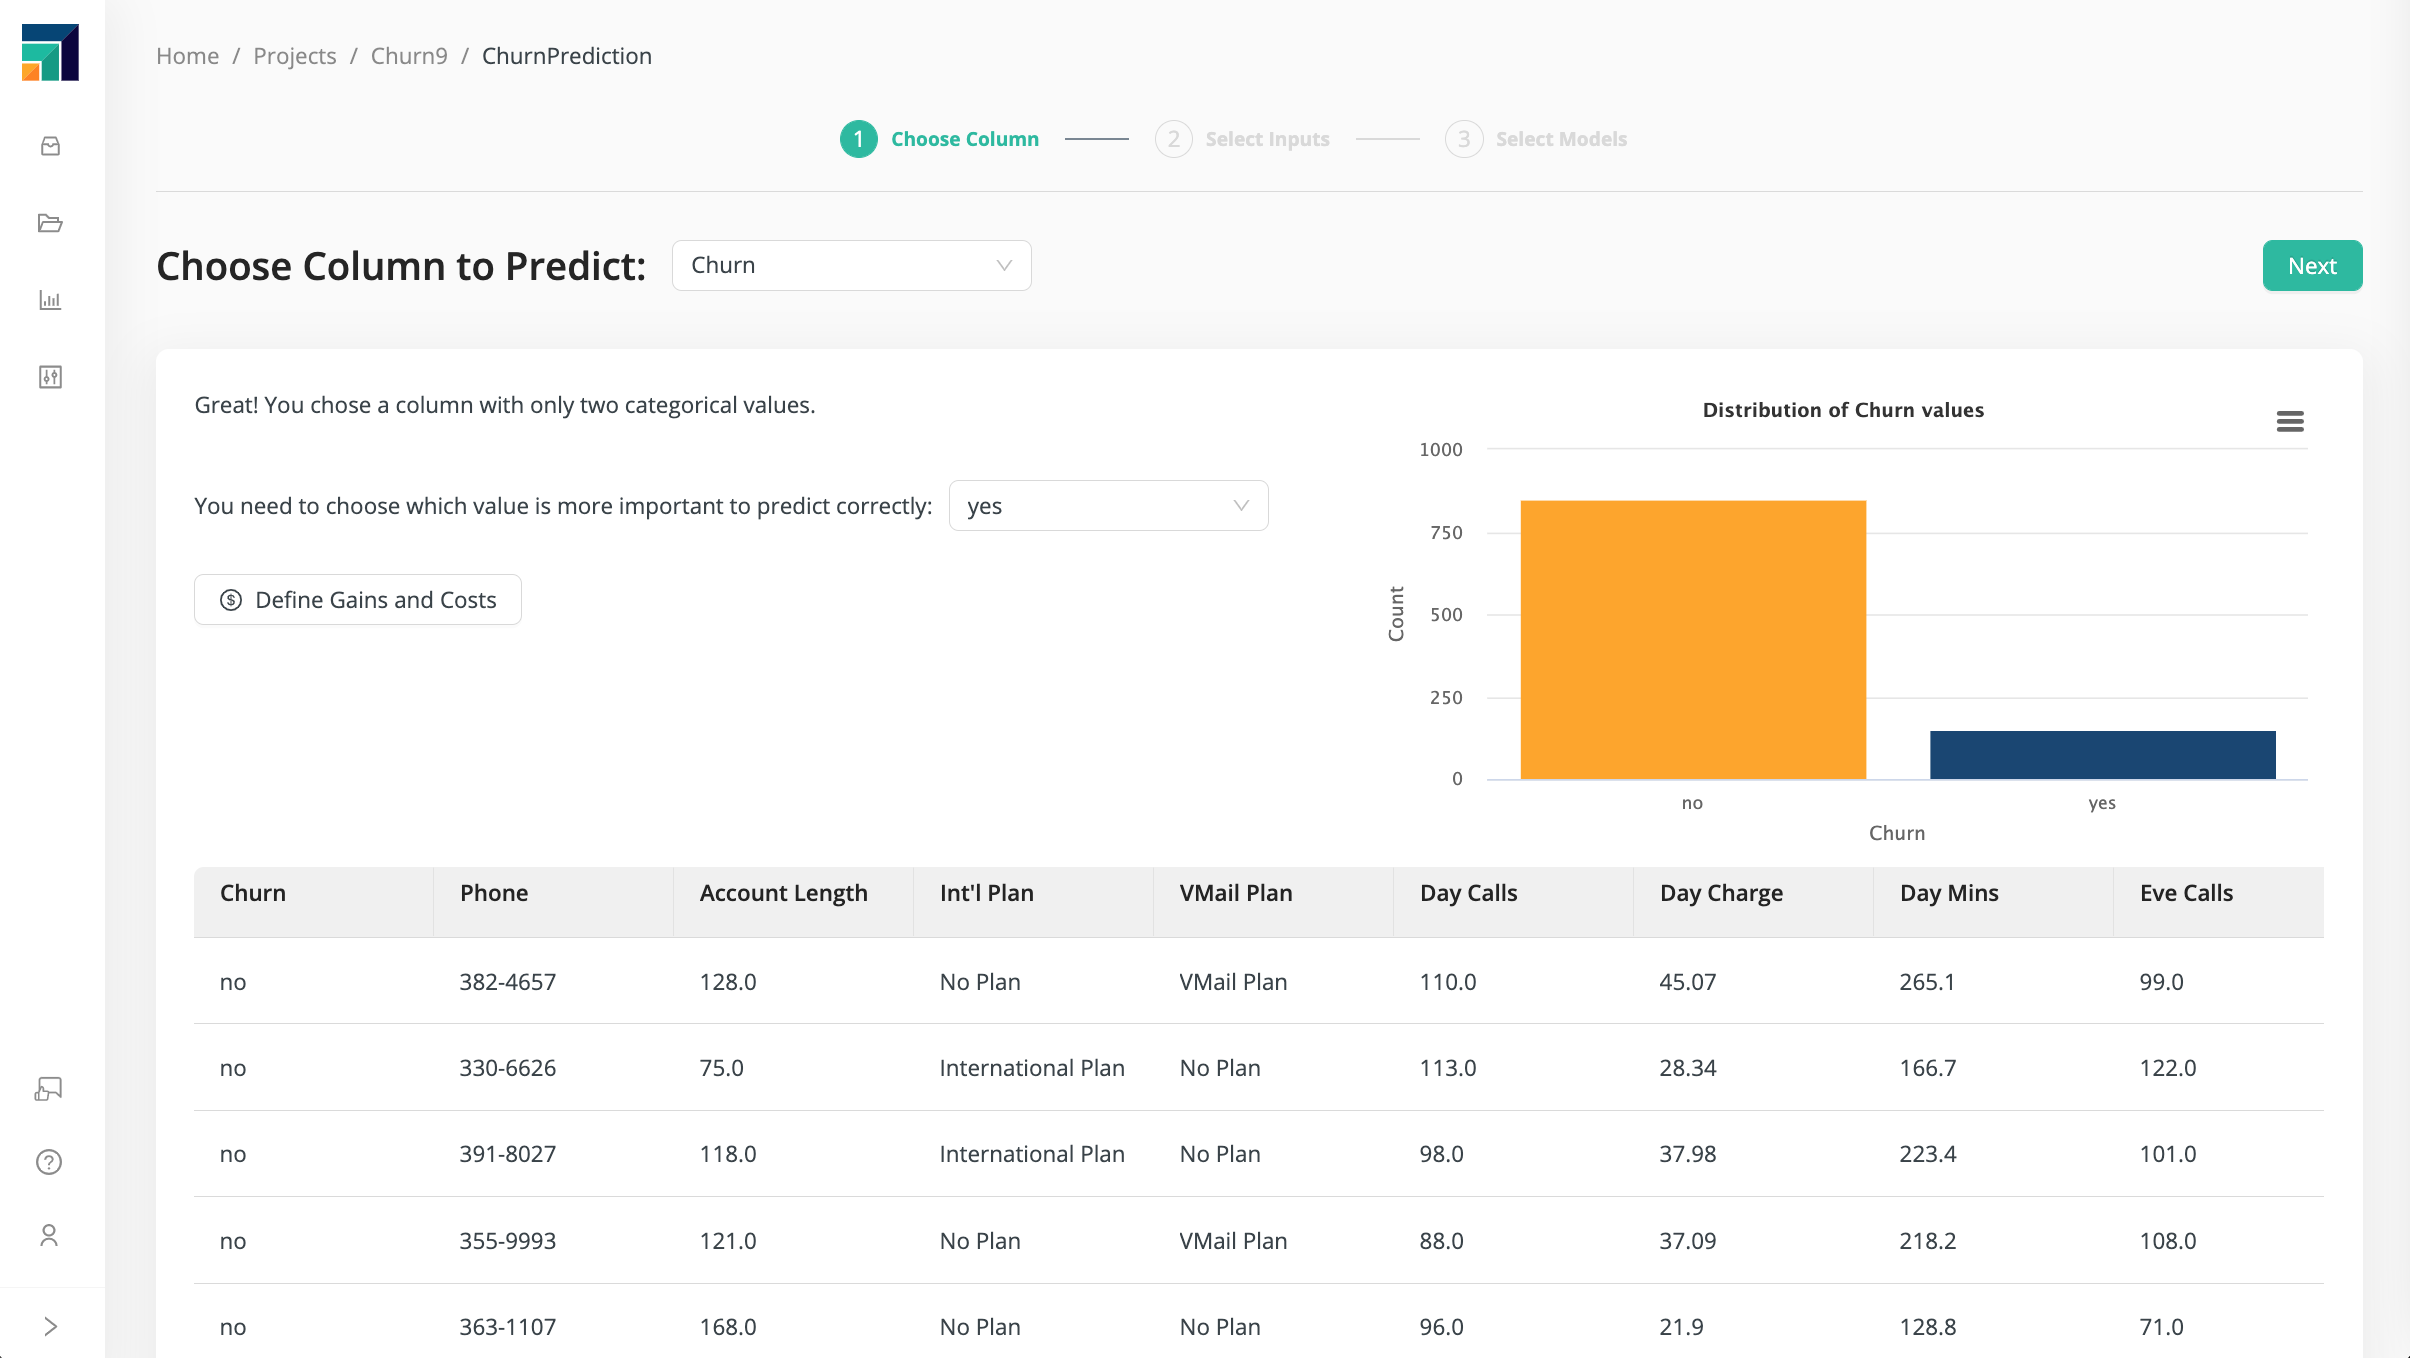
Our current problem, where
Churntakes the values "yes" or "no", is an example of a binary classification problem, with the focus on "yes", since we want to predict which customers will churn. -
Multiclass Classification (predicting one of three or more possible values)
If your target column has three or more non-numerical values, your problem is called a multiclass classification problem.
-
Regression (predicting numerical values)
If your target column is numerical, and you want to predict the numbers in that column, your problem is called a regression problem. For example, in our Churn Prediction Data, there is a column called
CustServ Callswhose value is the number of times a customer has called customer service.
Step 3: Select Inputs
Not all of your data columns will help you make a prediction. By discarding some of the columns, you may speed up your model-building and / or improve the model's performance. But how do you make that decision? A key point is that you're looking for patterns. Without some variation in the data and some discernible patterns, the data is not likely to be useful.
The four criteria that Auto ML uses to determine if a particular column is useful are:
- Correlation - how closely do the values resemble the target column?
- ID-ness - how different are the values from one another?
- Stability - how similar are the values to one another?
- Missing - how many missing values are in the column relative to the total?
Each column is marked with a quality tag: green, yellow, or red.
| Green Good quality | Yellow Needs examination | Red Poor quality |
|---|---|---|
| No problem! |
|
|
By default, Auto ML will deselect the columns marked with a red or yellow quality tag, but you are of course free to to select or deselect any columns you like! Usually the defaults will work well, but you should pay careful attention if a column is marked with a yellow tag and has high correlation.
To understand the issue with high correlation, consider an extreme example: perfect correlation. If you have two columns called X and Y, and X = Y, then the correlation is 100% and X is just another name for Y. If you are predicting X, you would discard the column called Y, because it's redundant. It may be redundant even if the correlation is less than 100%. Ask yourself the following question: will I have access to the data in the highly- correlated column prior to making a prediction? If not, the data is not useful.
In some cases, however, the column is useful for prediction, precisely because it is highly correlated with the target column; if you exclude it, you risk damaging your model. Only you can tell for certain. In case of doubt, you can create two models: one with the highly-correlated column and one without, to help you decide which is best.
Churn Prediction Data
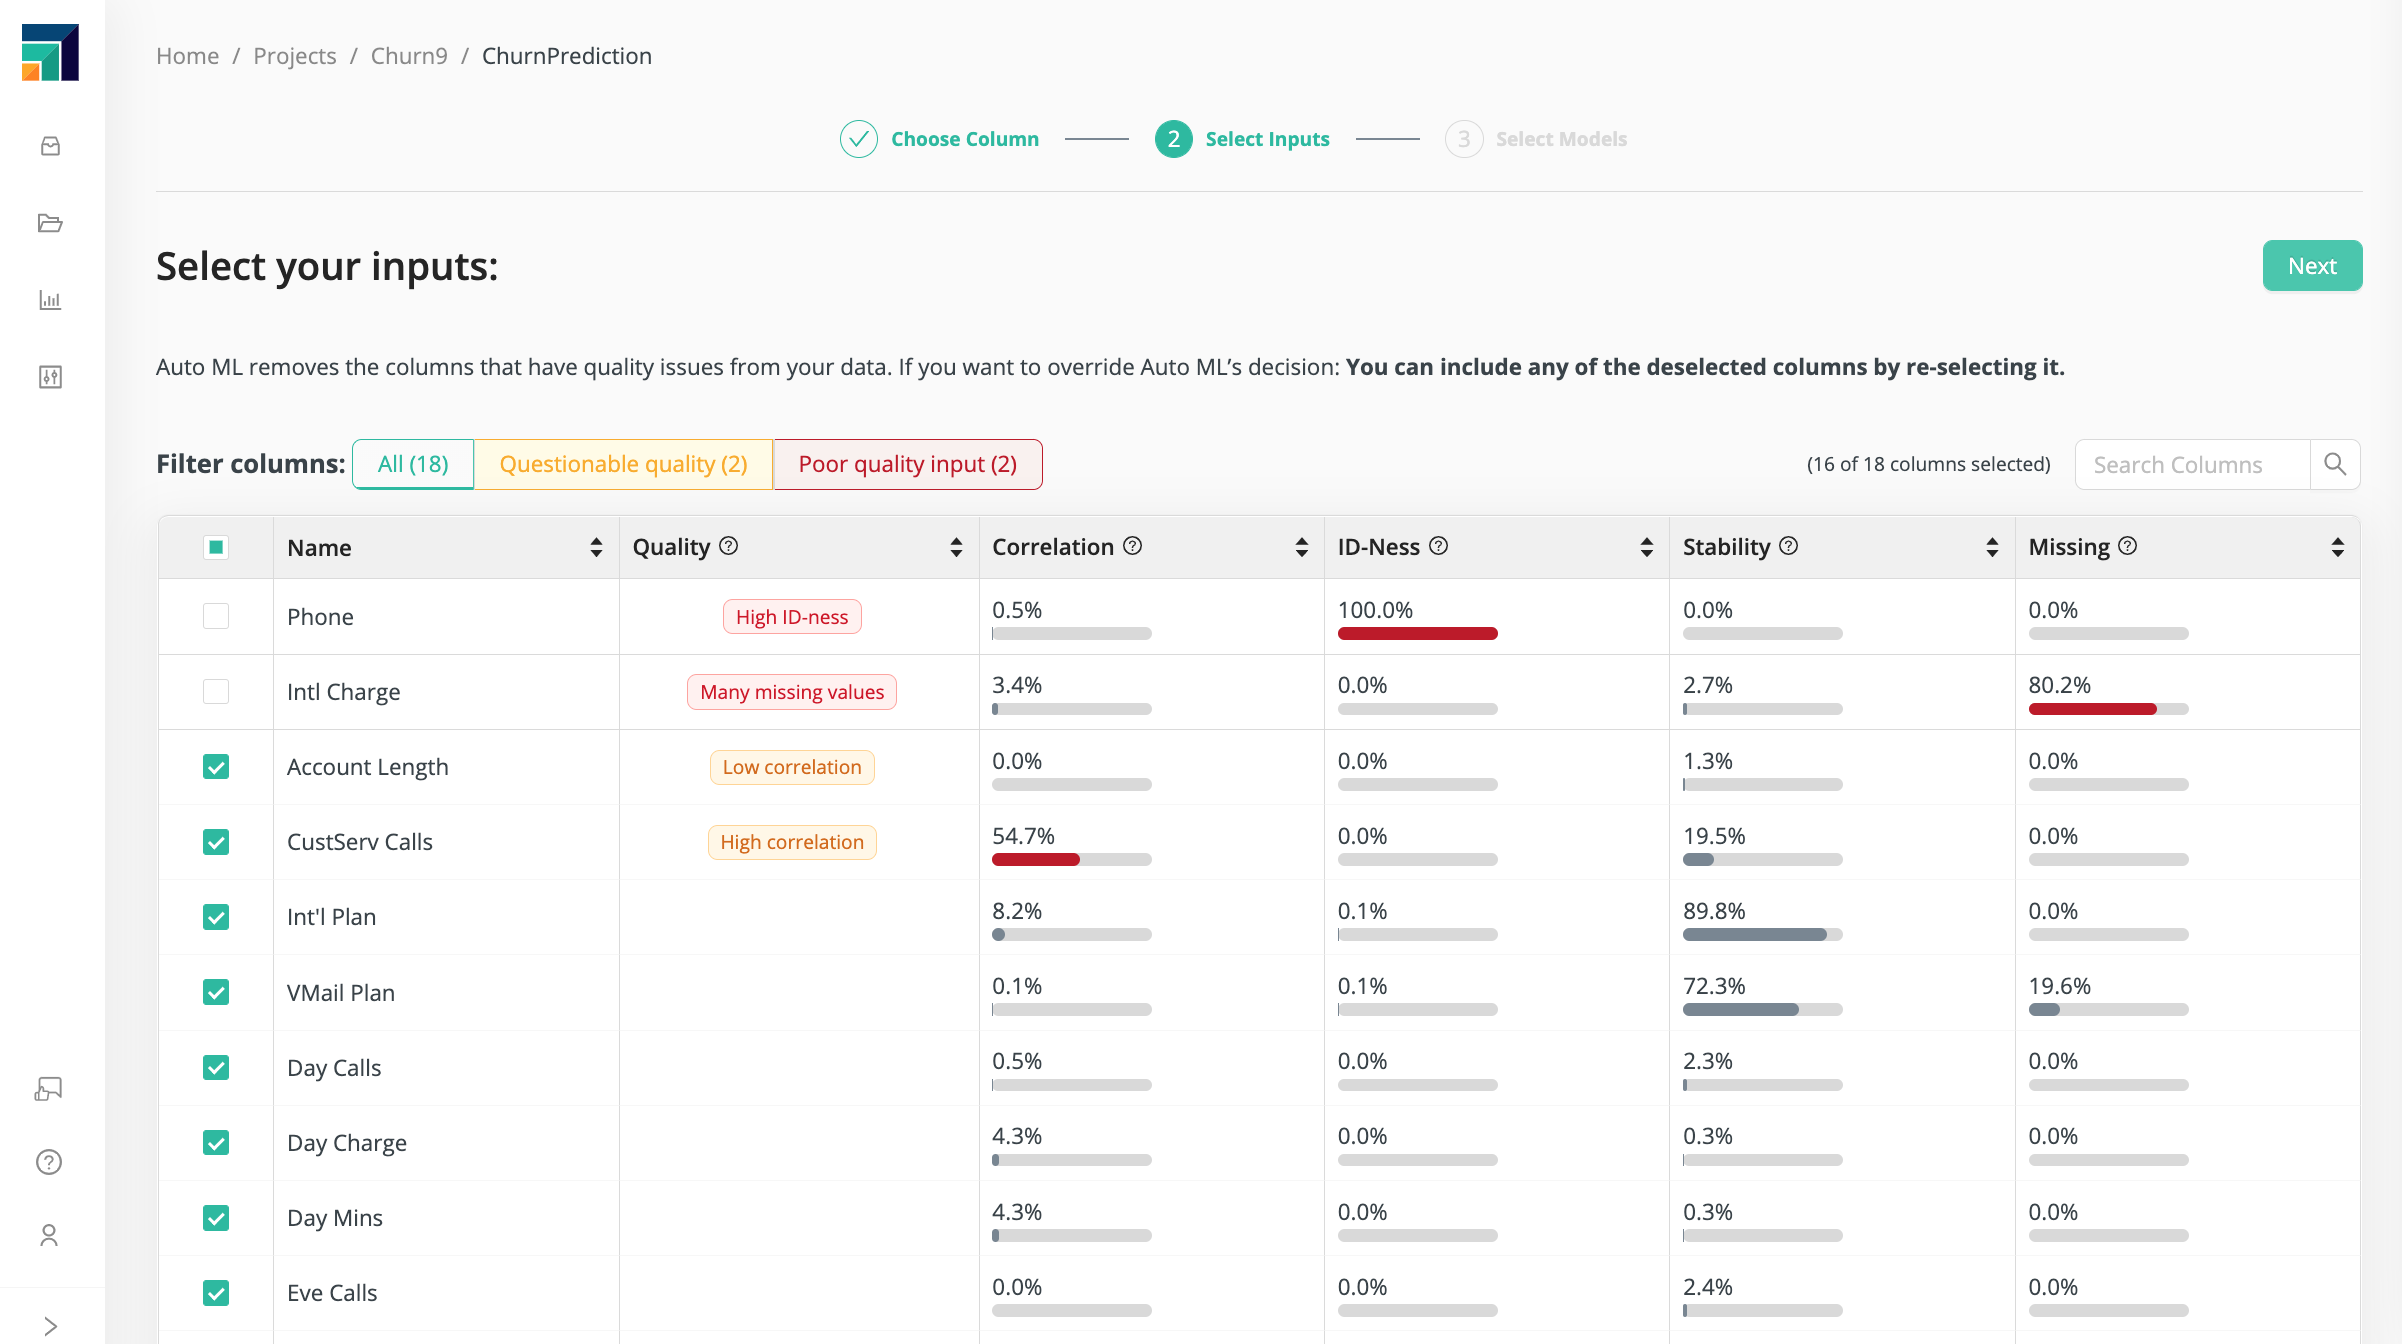
Auto ML identifies the following issues with our Churn Prediction Data:
- High ID-ness: the
Phonenumber is an ID, unique to each customer. It has no value in predicting churn. - Many missing values: only 3% of the customers have international charges (
Intl Charge), so this data column won't tell us much. - Low correlation: there is zero correlation between
Account LengthandChurn. It seems that there is little or no relation between the time a customer has been with the phone company and the probability that he will churn, soAccount Lengthis unlikely to be useful.
By default, Phone and Intl Charge are deselected.
Account Length is selected, but it appears to have little value.
Our attention should be focused on CustServ Calls:
- High correlation:
CustServ Callshas a 57% correlation withChurn
Apparently, the number of customer service calls is a good indicator of churn.
The phone company would be well-advised to take proactive steps to keep
the customer if the customer has called customer service repeatedly.
But do you want to include CustServ Calls when building your model?
Let's return to the question we asked a moment ago:
will I have access to the data in the highly-correlated column prior to making a prediction?
In this case, the answer is yes.
We choose therefore to include CustServ Calls in our model, with the understanding that the
predictions of the model will be heavily weighted towards the value in that column.
Jump ahead to see the results with and without the customer service call data
Step 4: Select Models
Auto ML provides some of the more popular machine learning algorithms. Depending on the type of data in your target column, only a subset of these algorithms may be available.
| Model | Binary classification | Multiclass classification | Regression |
|---|---|---|---|
| Naïve Bayes | |||
| Logistic Regression | |||
| Deep Learning | |||
| Decision Tree | |||
| Generalized Linear Model | |||
| Random Forest | |||
| Gradient Boosted Trees | |||
| Support Vector Machine | |||
| Fast Large Margin |
Depending on your use case, you may want to explore all of the models or only a subset. With a subset, you can the reduce training time or focus on models that are easy to understand. We have organized the models into 3 categories based on training time and interpretability. Within each group, you can enable or disable Column Analysis and Data Preparation features.
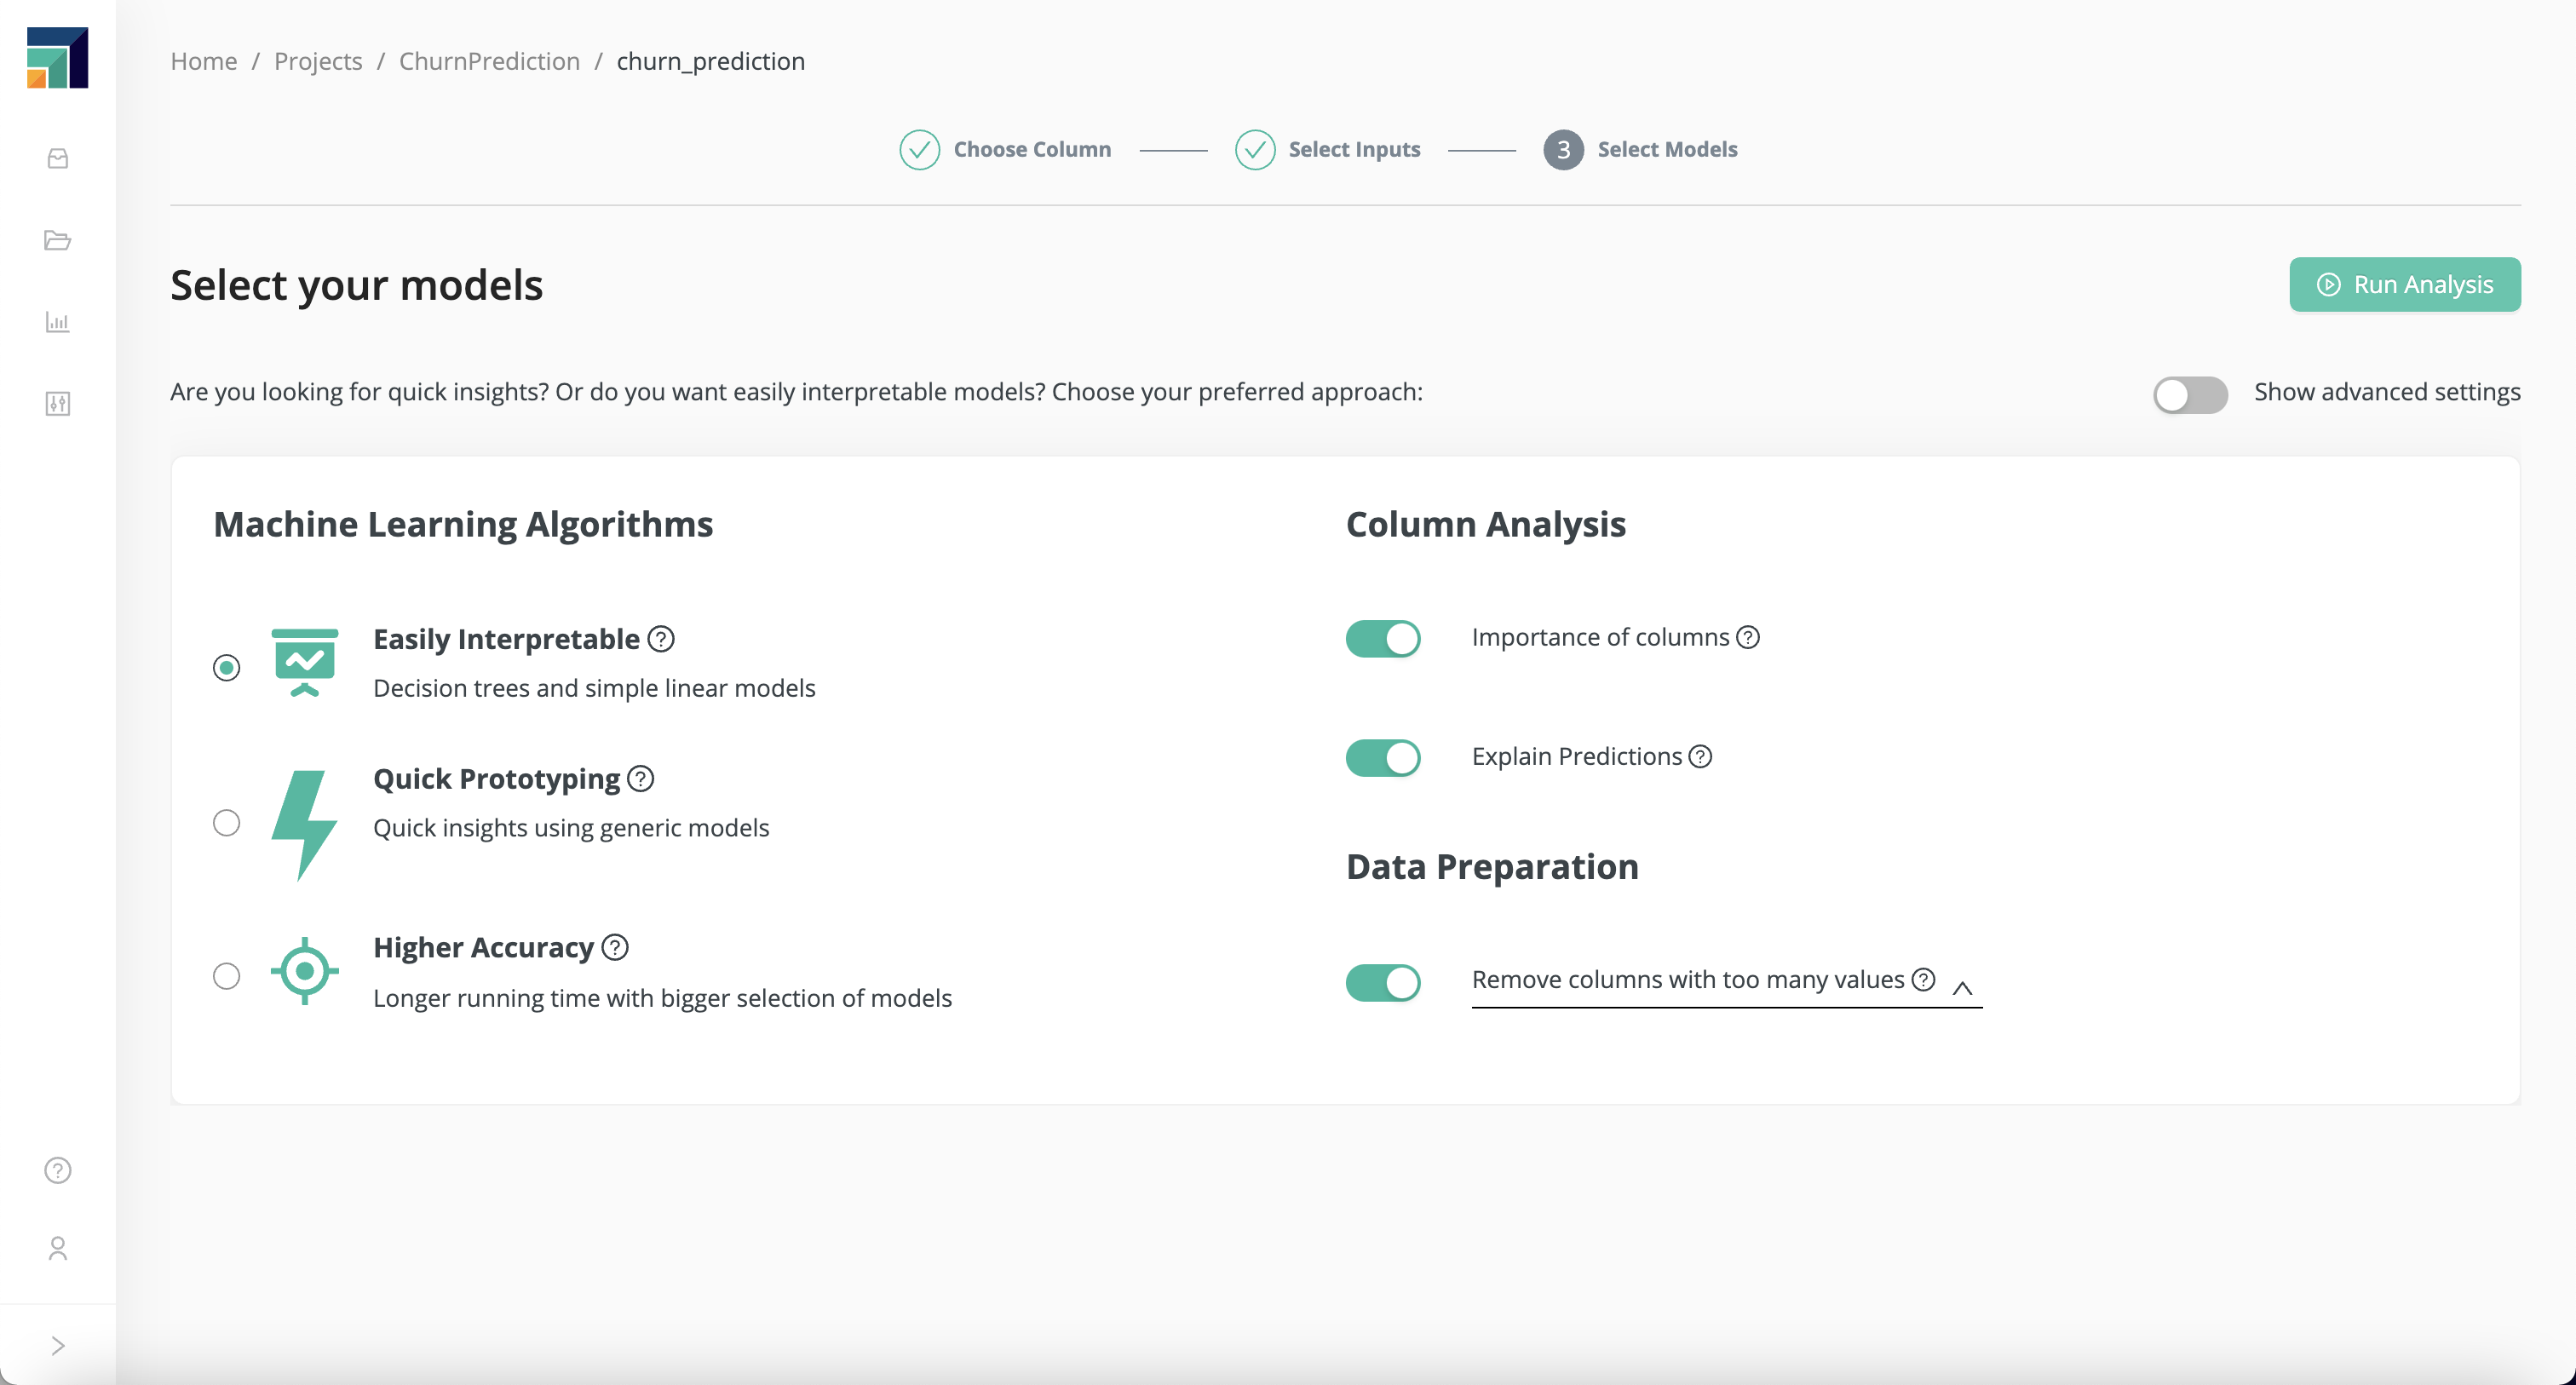
Easily interpretable
Easily interpretable models are relatively easy to understand. The Column Analysis options, if enabled, will help you to better understand how the predictions are made, and the importance of each column.
Quick prototyping
If you are short on time or you only want to do a quick test, choose Quick Prototyping. The models in this group have a very small footprint and are usually the fastest when it comes to training time. Column Analysis options are turned off to ensure the shortest possible training time.
Higher accuracy
With Higher Accuracy, you can explore the whole set of available models. The trade-off is the potential waiting time; depending on the characteristics of the training data, it can be quite long. By default, we disable the Column Analysis options to reduce training time, but you should feel free to re-enable them if you need more insight into model behavior.
Show advanced settings
Under Show advanced settings, you can review and modify the list of selected models. In addition, you can change the sampling method (the way we split your data into training and test sets).
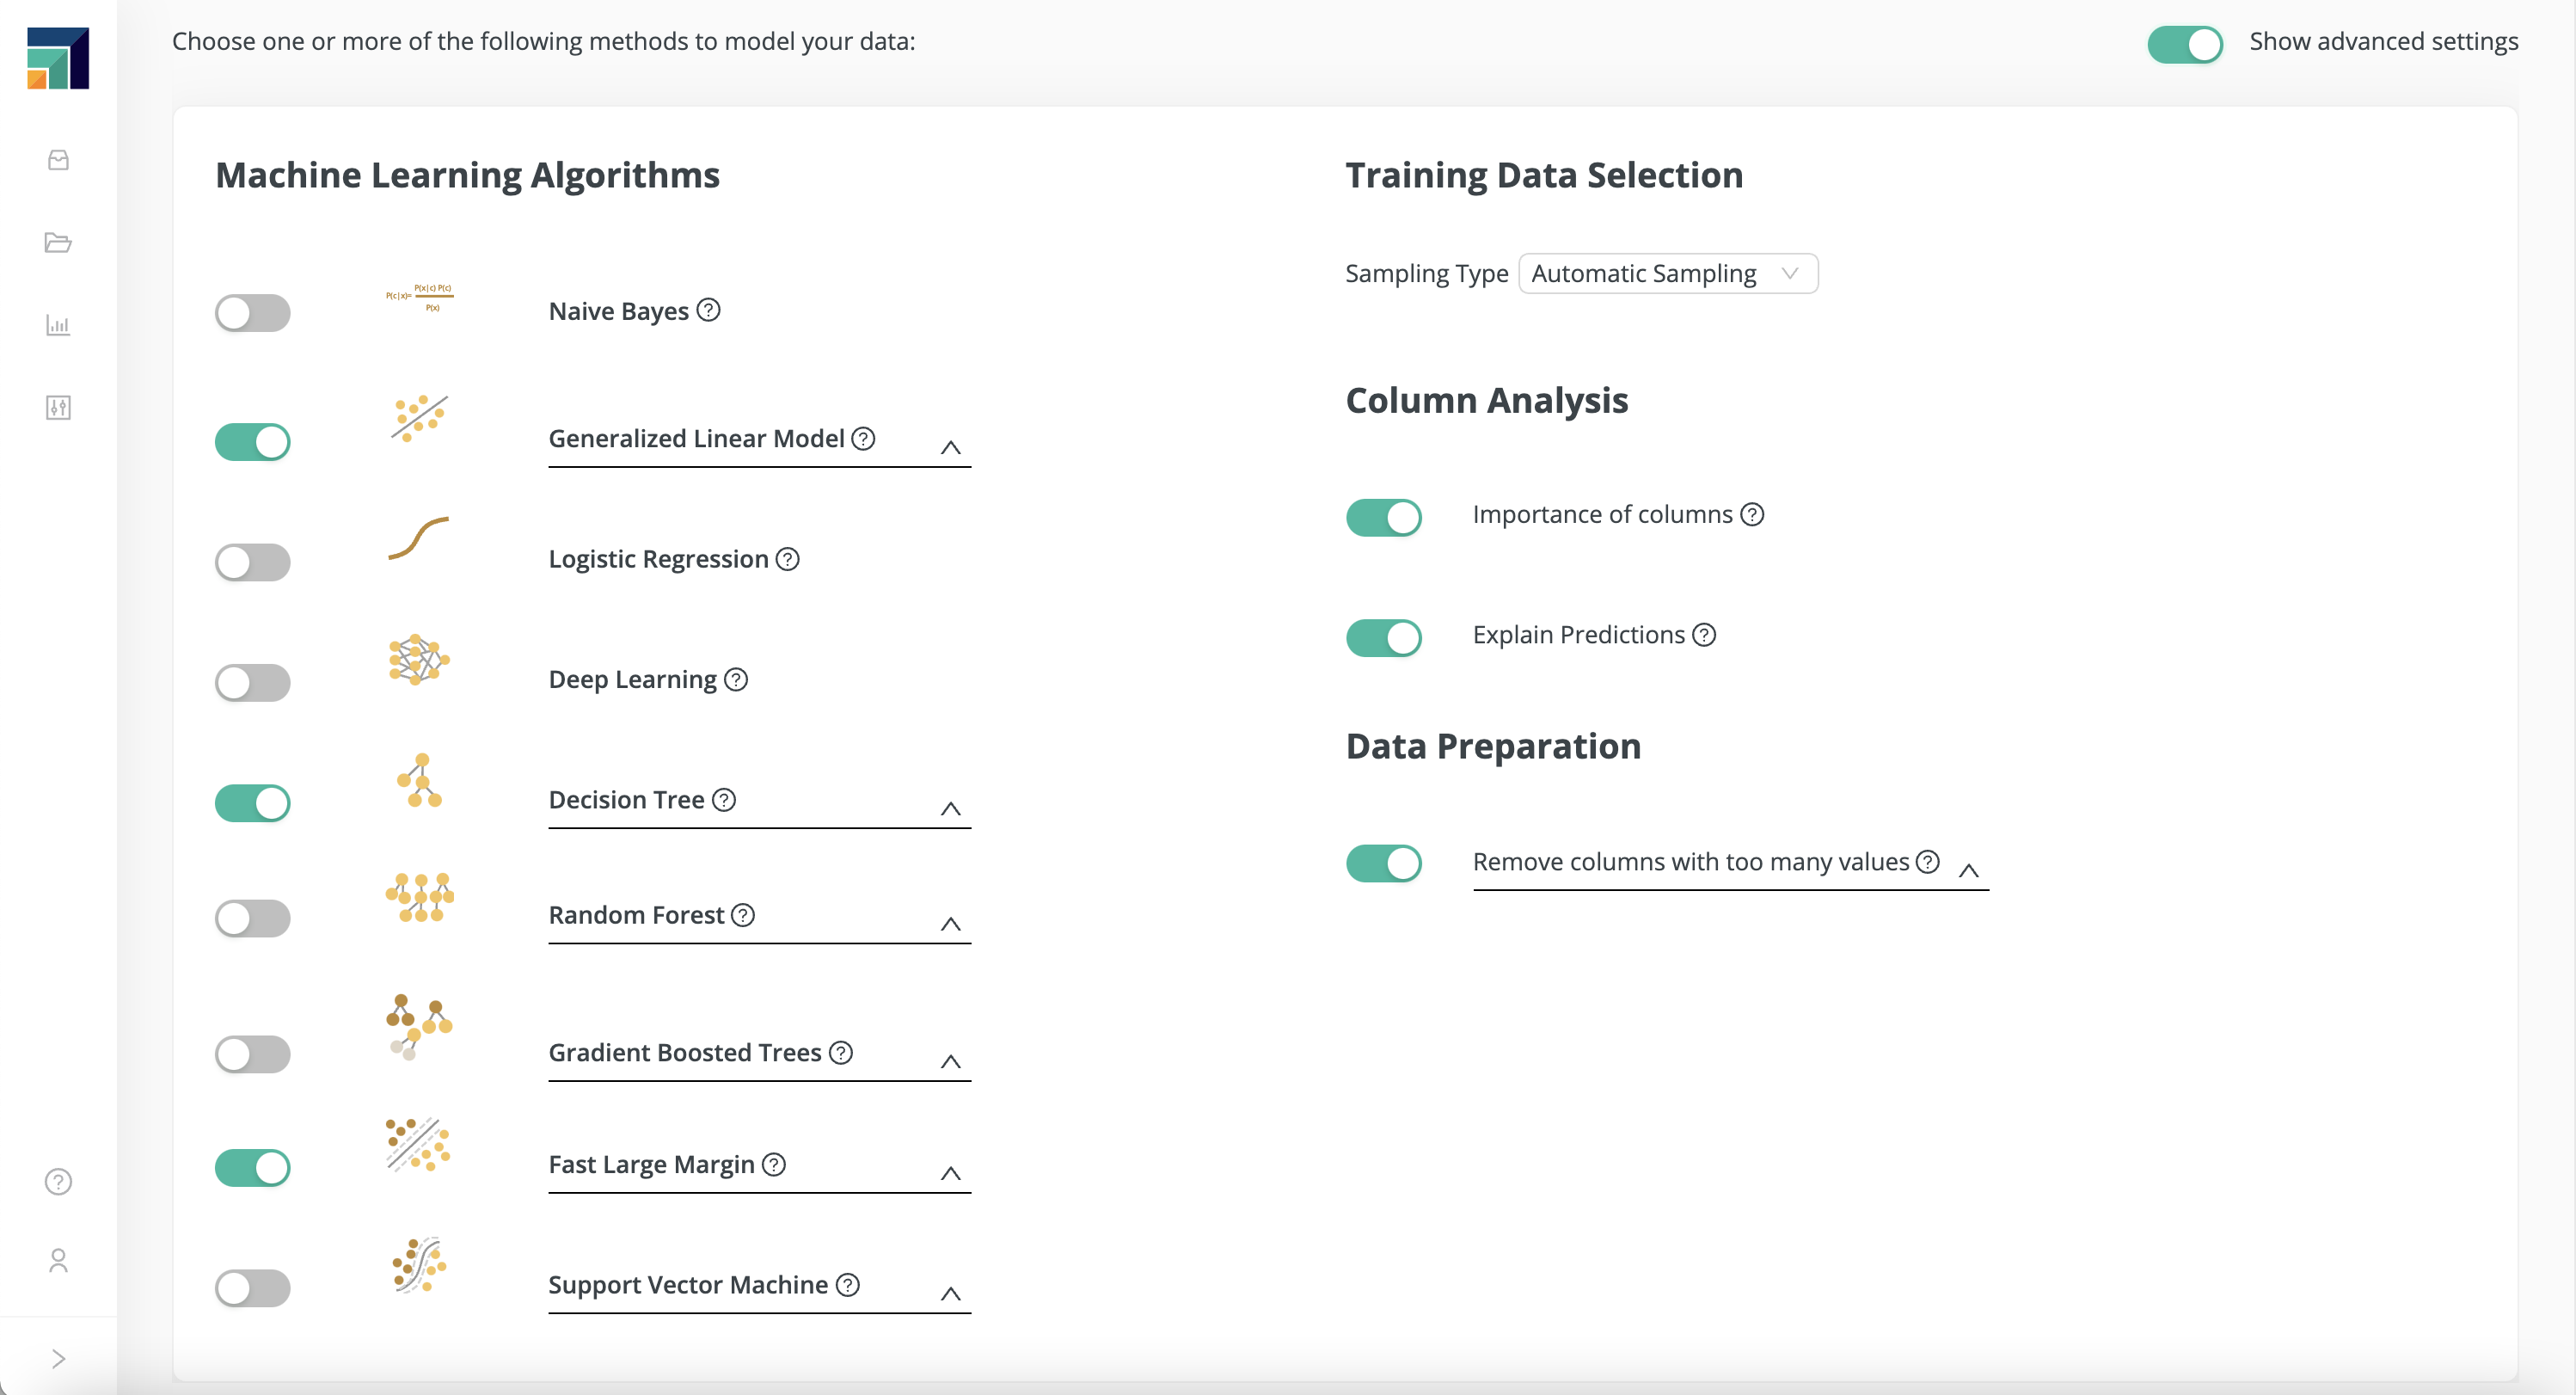
Training Data Selection
Changing this setting may cause training errors, especially when training on imbalanced data sets! An example of an imbalanced data set is fraud detection, when most of the data is non-fraudulent, but a tiny fraction is fraudulent.
| Training set | Test set |
|---|---|
| 60% | 40% |
Automatic Sampling randomly builds subsets to avoid potential bias coming from row order. When the target column is categorical, it builds training and test sets through random selection while keeping the same class distribution as in the original data set.
Linear Sampling will keep the order of the original data set when building training and test sets. This option is useful when the rows are not independent (e.g., time series data).
Select the group or choose individual models, and press Run Analysis.
Next: Inspect models
Further Reading
The links below provide more information about the predictive model algorithms used in Auto ML:
- Naïve Bayes
- Logistic Regression
- Deep Learning
- Decision Tree
- Generalized Linear Model (GLM)
- Random Forest
- Gradient Boosted Trees
- Support Vector Machine
- Fast Large Margin